The analysis covers 319 waterfront single-family closings at $5 million and above across Jupiter Island, mainland Jupiter, and Jupiter Inlet Colony from 2020 through 2025, sourced from BeachesMLS. For each transaction, we track sale price, price per square foot, days on market, and sold-to-list ratio, then segment by submarket and calendar year.
2021 produced $831.2 million across 70 closings, the six-year volume record. Jupiter Island alone accounted for $452.4 million that year, exceeding the entire mainland total of $367.3 million. 2025 produced $764.5 million across 56 closings: second in the dataset. The distinction matters for sellers setting price expectations and buyers evaluating entry timing.
A Market That Repriced
Between 2020 and 2025, median price-per-square-foot approximately doubled across all three submarkets, with Inlet Colony reaching 203% appreciation over the period. The gains held through the 2022 rate shock and the 2023 volume contraction on Jupiter Island. No submarket has recorded a median $/SF below its prior-year figure in any year since 2020.
Jupiter Island entered 2020 with a median days-on-market of 386 days at the $5 million-plus waterfront tier. That figure collapsed to 46 days in 2021 and reached a floor of 18 days in both 2022 and 2023. Median $/SF moved from $1,182 in 2020 to $1,862 in 2021, a 57% move in a single calendar year. The 2022 and 2023 figures reflect a market holding those gains under rising rate conditions.
$5M+ waterfront closed sales: Jupiter Island, Mainland Jupiter, Jupiter Inlet Colony
All three submarkets approximately doubled median $/SF between 2020 and 2025. The 2021 liquidity event compressed Jupiter Island DOM from 386 to 46 days and repriced the barrier island by 57% in a single year. No submarket has recorded a median $/SF decline versus its prior peak in any subsequent year. Inlet Colony's 203% figure is directionally robust across a 13-transaction, six-year sample, but the 2025 endpoint is a single transaction and carries a wide statistical margin.
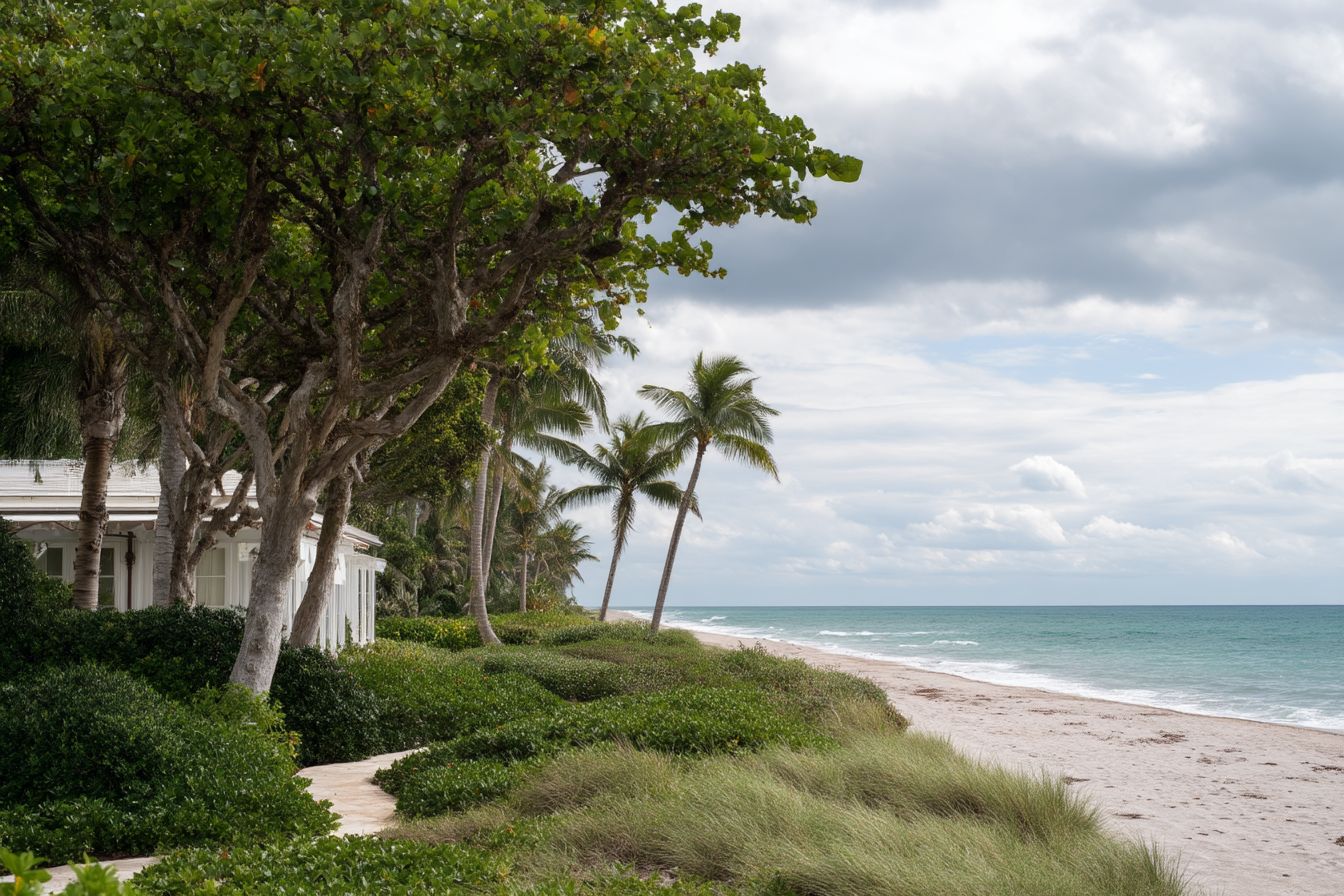
The Scarcity Premium
The clearest structural premium in this dataset does not belong to Jupiter Island. It belongs to Jupiter Inlet Colony.
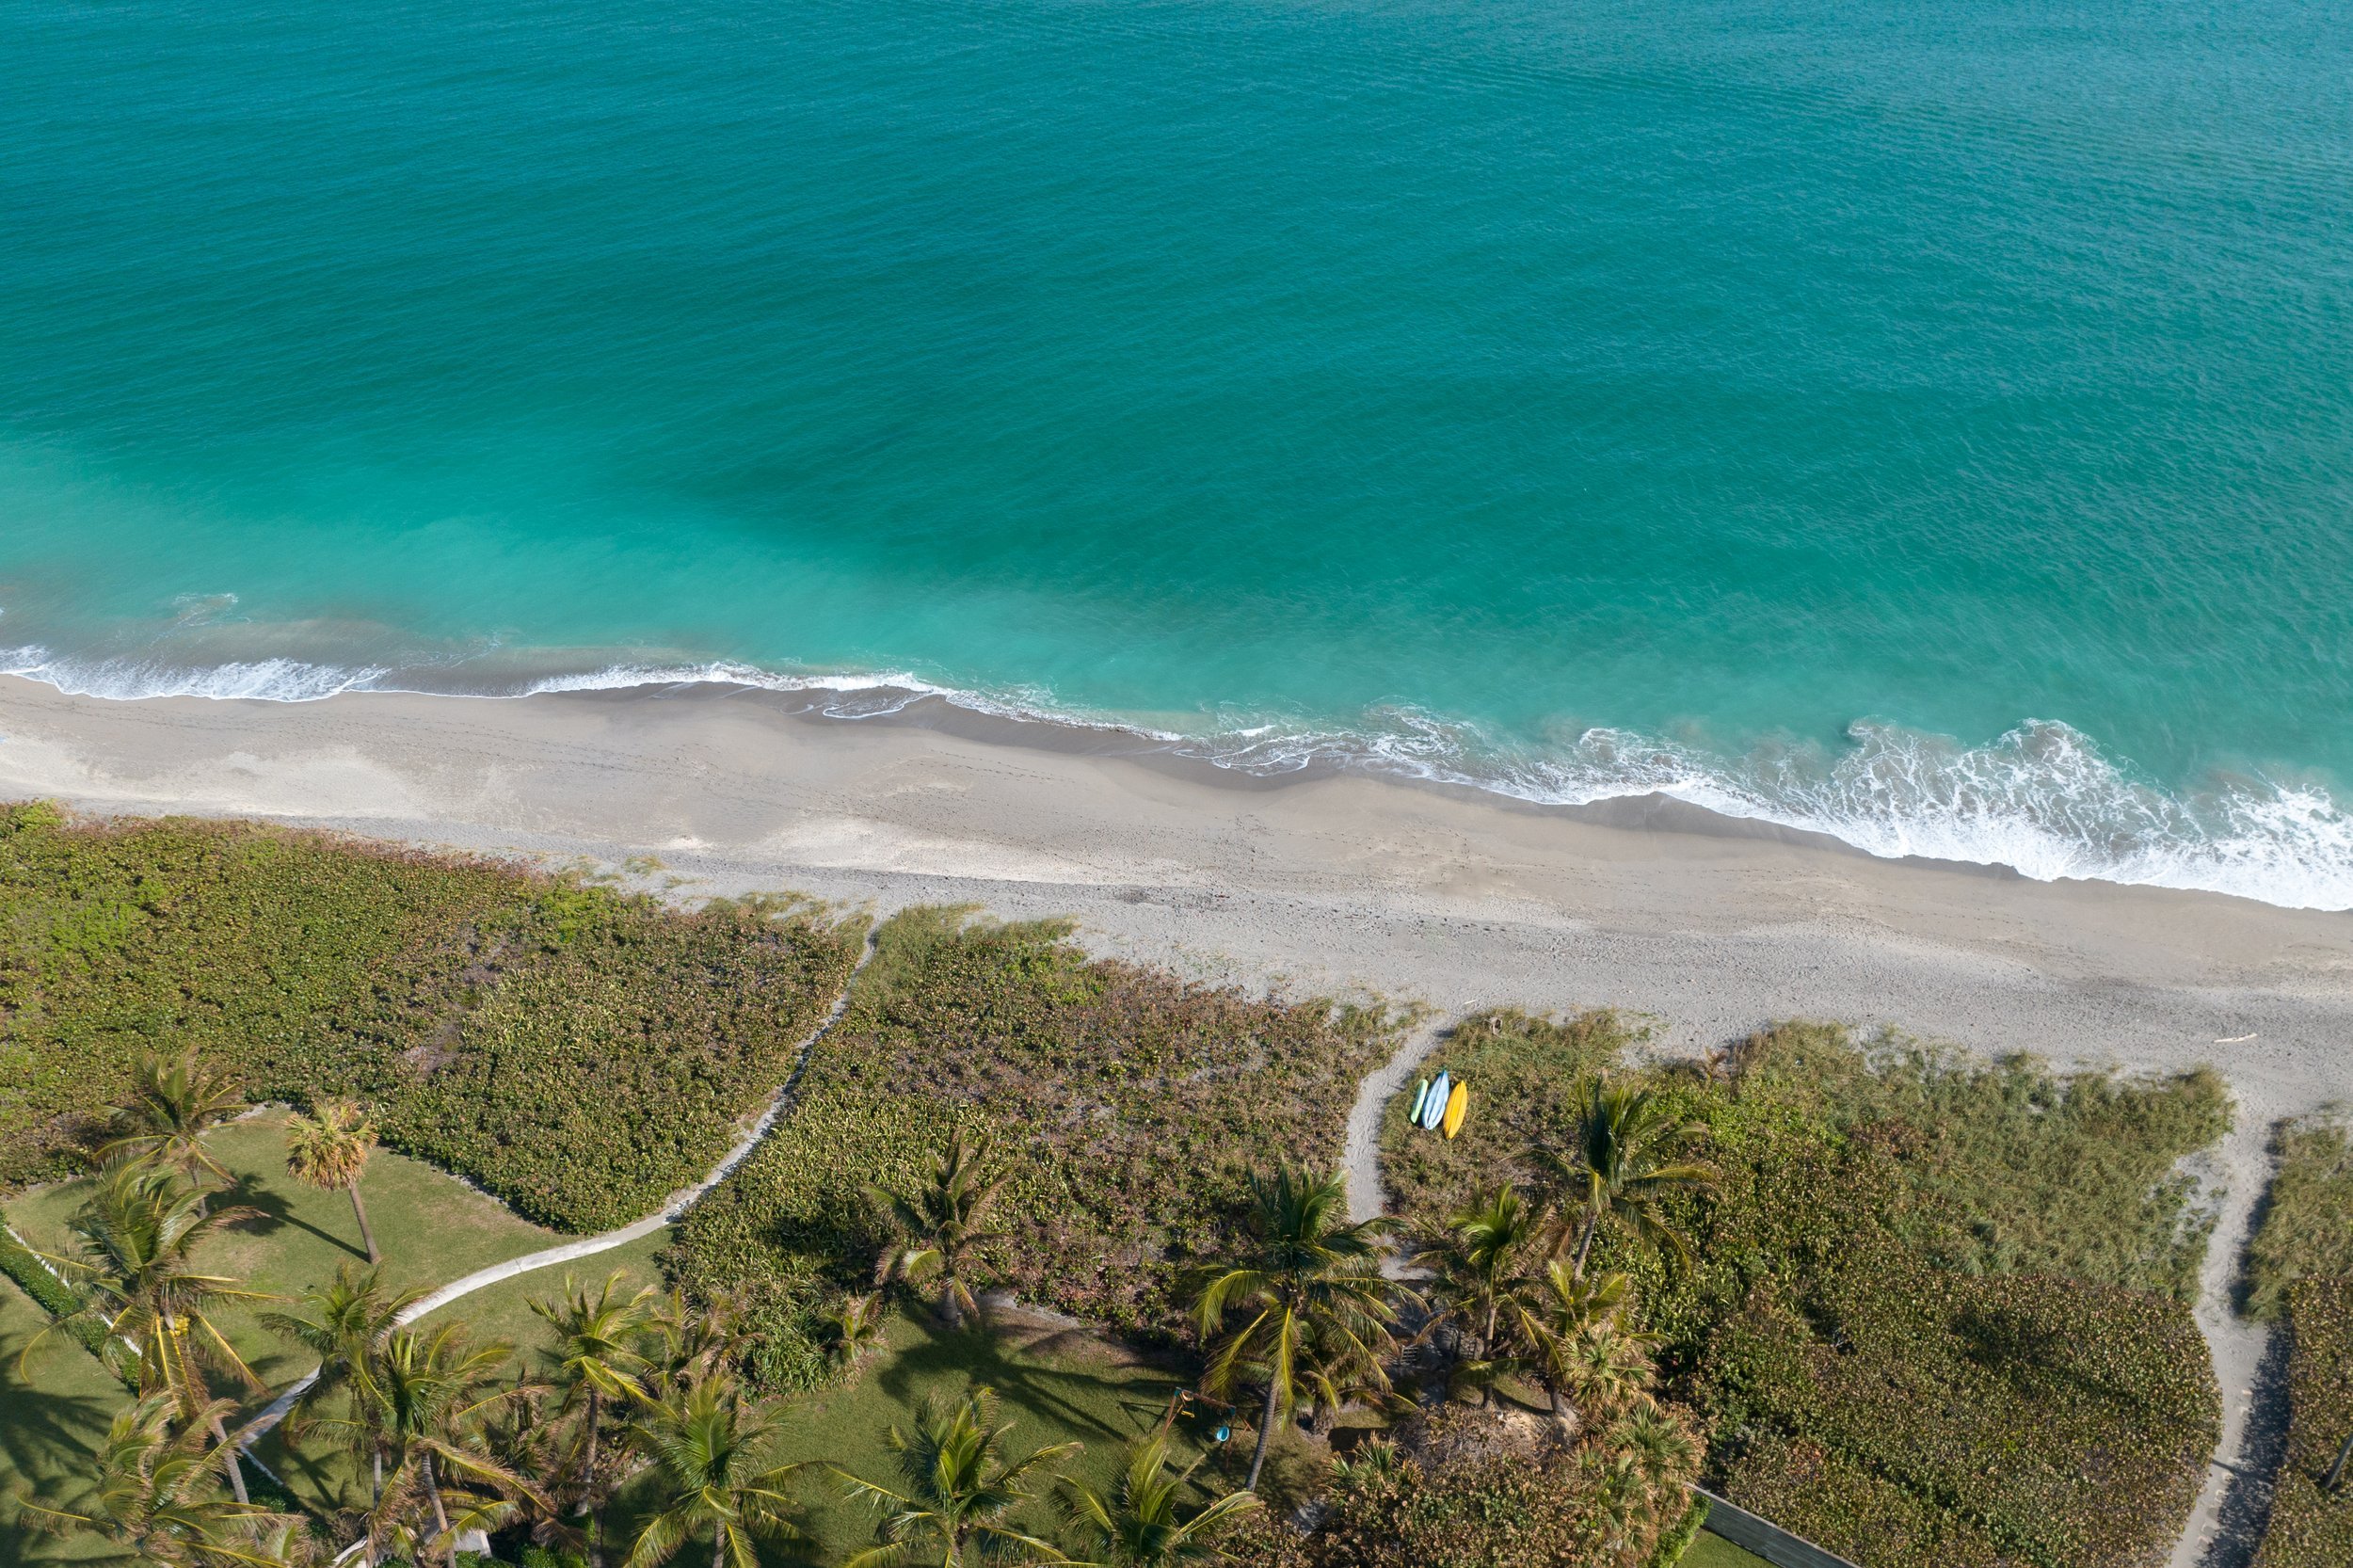
Inlet Colony produced 13 waterfront closings above $5 million over the six-year period, an average of 2.2 per year. Jupiter Island produced 100 closings in the same period, averaging 16.7 per year. The scarcity differential runs approximately 7 to 1, and it is reflected in both price appreciation and transaction velocity. Median $/SF at Inlet Colony exceeded Jupiter Island in each of 2022, 2023, and 2024, peaking at $3,135 per square foot in 2024 against Jupiter Island's $2,019 that year. Median days-on-market across all 13 Inlet Colony waterfront closings above $5 million in this dataset is 13 days.
Indexed to a 2020 base of 100, the six-year median price trajectory reaches 394 at Inlet Colony, 277 at Jupiter Island, and 156 on the mainland. These are submarket-level medians, not individual property return guarantees. Inlet Colony has ranked first on this index in each year since 2022.
100 closings above $5M over six years (16.7 per year). Median $/SF moved from $1,182 in 2020 to $2,559 in 2025, up 116%. The 2021 liquidity event compressed DOM from 386 days to 46 days; the island has not returned to pre-2021 absorption speeds. Oceanfront and Intracoastal inventory across Martin County (Zip 33455). 2025 price range: $5.20M to $39.00M. Total six-year volume at $5M+: $1.41 billion.
206 closings above $5M over six years (34 per year). Median $/SF moved from $913 in 2020 to $1,832 in 2025, up 101%. The broadest inventory base of the three submarkets, encompassing river-front, Intracoastal, and canal-front communities in Palm Beach County: Admirals Cove, Loxahatchee River estates, and the 33477 coastal corridor. 37 sales and $393.7M in 2025.
13 waterfront closings above $5M over six years (2.2 per year). Median $/SF exceeded Jupiter Island in 2022, 2023, and 2024, reaching a dataset peak of $3,135 in 2024 (3 closings). Three consecutive years (2022-2024) produced S/L ratios above 98%, with 2023 closing at 100%. Median DOM across all 13 six-year closings: 13 days.
Negotiating by Submarket
The three submarkets closed 2025 under materially different supply-demand conditions. Aggregate figures ($764.5 million, 56 closings, 53-day median DOM) do not reflect any individual submarket's negotiation environment. The closed data by submarket does.
On the mainland, 8 of 37 closings at or above ask indicate a seller's market on correctly priced inventory. Median DOM of 53 days has improved from 82 days in both 2020 and 2021, and the 95.7% median S/L has been consistent across five of the six years in the dataset. There is no statistical evidence of buyer-side leverage in mainland Jupiter in 2025.
On Jupiter Island, 8 of 18 closings fell below 90% sold-to-list. The 91.2% median S/L is the lowest recorded for this submarket since 2020. The original-to-sold ratio of 85.4% indicates sellers repriced substantially before closing on a significant share of inventory. Buyers willing to commit to a 60-to-90-day process on properties that have already reduced have negotiating room at the median and above.
Jupiter Inlet Colony recorded one waterfront closing above $5 million in 2025: 117 days on market, 84.1% sold-to-list. The prior three years produced 2-3 closings annually at median DOMs of 7 to 19 days and S/L ratios above 98% in each year, including 100% in 2023. A single transaction is insufficient to characterize current market conditions in this submarket. Any negotiating position or pricing strategy for Inlet Colony requires direct comp analysis against the full six-year transaction record.
Bottom Line
The appreciation cycle has not peaked. Every submarket has approximately doubled its median price per square foot since 2020, and none has recorded a year-over-year decline in that metric at any point in the dataset. The more actionable finding is that the three submarkets are operating under entirely different negotiation conditions in 2025. Mainland Jupiter is a seller's market where correctly priced inventory clears near ask. Jupiter Island has shifted toward buyers, with a significant share of closings settling well below the last listed price. Inlet Colony trades too thinly for any single year to characterize, but its six-year trajectory leads the dataset on both appreciation and absorption speed.
For Jupiter Island buyers: Patience is leverage. Target properties that have already reduced, plan for a 60-to-90-day process, and anchor your offer to the submarket's current sold-to-list pattern. The asking price is not the market price on the island right now.
For mainland Jupiter sellers: The data supports your pricing. List at market, prepare for a sub-60-day timeline, and resist the impulse to leave negotiating room. Buyers in this submarket are closing near ask on correctly priced inventory, and that pattern has held for five consecutive years.
For Inlet Colony: Aggregate statistics do not apply here. Thirteen transactions over six years means every comp matters individually. Any pricing or offer strategy requires a property-level walkthrough of the full transaction record, not a market report.
Analysis covers single-family residential waterfront closed sales at or above $5 million in the Greater Jupiter area, calendar years 2020 through 2025. Jupiter Island submarket is defined as Zip Code 33455 (Martin County barrier island, including Hobe Sound and Jupiter Island municipality). Mainland Jupiter is defined as City = Jupiter, Palm Beach County, Waterfront = Yes, encompassing river-front, Intracoastal, and canal-front communities in Zip Codes 33477 and 33458. Jupiter Inlet Colony is defined as Zip Code 33469, Waterfront = Yes. Data for Jupiter Island and mainland Jupiter was extracted from a single BeachesMLS export covering both Palm Beach and Martin counties. Inlet Colony data was pulled from a separate MLS export covering all price points from $2M upward; only waterfront records at or above $5M are included in the analysis.
Sold price, list price, living area, and days on market were extracted directly from MLS records. Days on market reflects cumulative DOM as reported by the listing brokerage. Sold-to-list ratio uses the last recorded list price. Original-to-sold ratio, where cited, uses the original list price field where populated. Median statistics for Inlet Colony are based on 13 total waterfront closings over six years (average 2.2 per year); individual year figures are based on 1-3 data points and carry wide statistical margins. The 2025 Inlet Colony $/SF of $2,684 is based on a single transaction and should be treated as directional only.
Directional characterizations of the negotiation environment reflect practitioner observation across BeachesMLS closed data. References to sold-to-list patterns are directional and should not be applied to individual property underwriting without direct MLS comp analysis. Figures vary by price tier, property type, and listing period.
BeachesMLS closed sales data, Palm Beach County (Zip Codes 33477, 33458, 33469), 2020-2025. BeachesMLS closed sales data, Martin County (Jupiter Island / Hobe Sound / Zip Code 33455), 2020-2025. Jupiter Inlet Colony data, Zip 33469, pulled separately and merged. Data accessed March 2025 via Spark/BeachesMLS. Palm Beach Luxury at Compass submarket classification and analysis.