What follows is a side-by-side comparison built on closed-sale transaction data. The Jupiter figures come from BeachesMLS property-level records (waterfront single-family only); the Miami Beach figures come from luxury segment reports. The two datasets use different methodologies, and where that asymmetry affects interpretation, it is noted. The physical variables that separate the two markets - frontage, dock geometry, vessel clearance, and population density - do not appear in per-square-foot figures, but they determine daily utility, long-term satisfaction, and resale.
The Market Data: What Each Submarket Is Actually Trading At
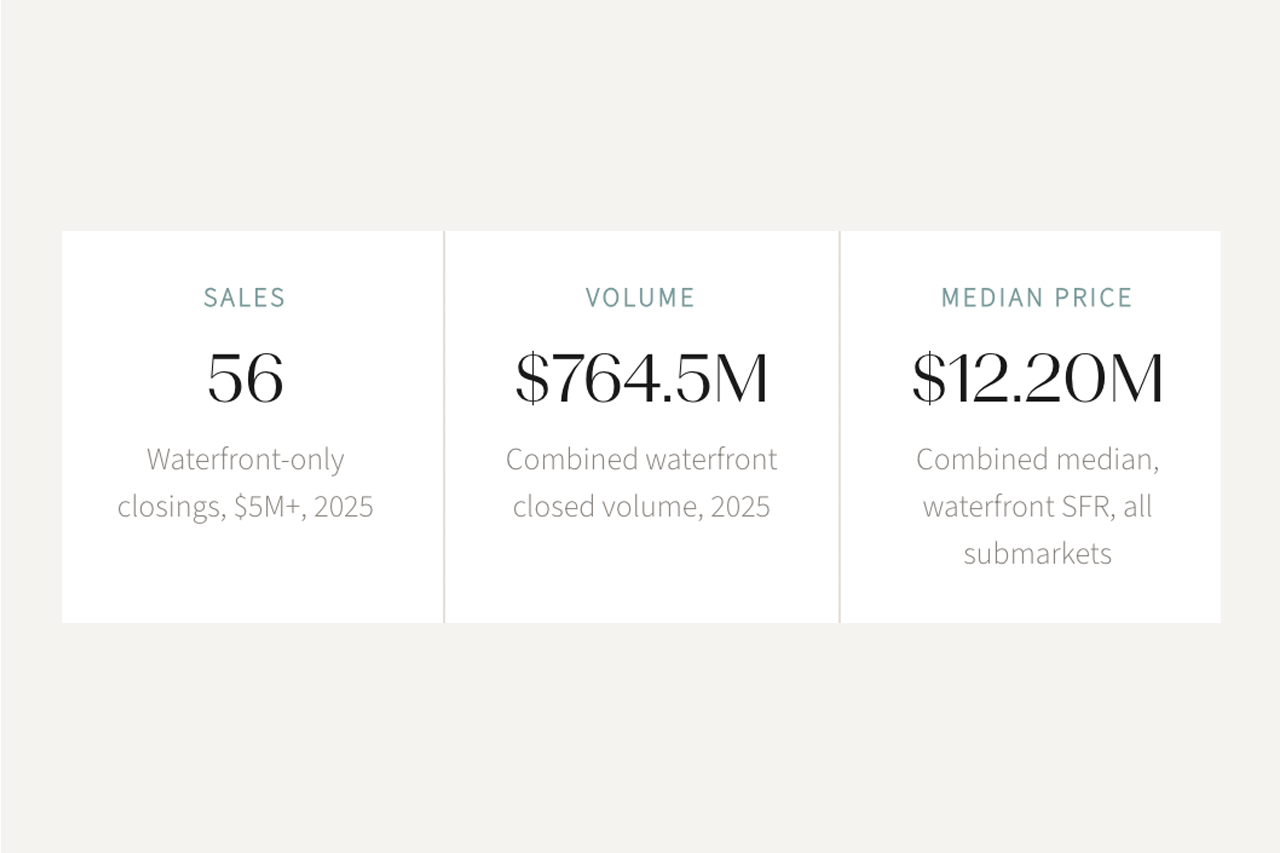
The Jupiter figures below are property-level closed sales from BeachesMLS (waterfront single-family only, $2M+ tier, 51 transactions). The Miami Beach figures are segment-level averages from luxury market reports (top 10% by price). These datasets use different methodologies and different levels of granularity; they are presented side by side for directional context. Where comparability is limited, it is noted.
Jupiter: BeachesMLS Area 5040, waterfront SFR only, closed sales. Miami Beach: luxury segment reports, top 10% by price. Methodologies differ; see Methodology & Notes.
Rhythm and Density: The Number Behind the Feeling
Population density is not an aesthetic preference; it is a structural variable that shows up in school runs, marina access, and commute friction. The gap between Jupiter and Miami in this respect is structural, not cyclical, and it cannot be resolved by wealth.
The northern Palm Beach corridor has seen sustained inbound migration from financial services and family office principals over the past several years. That demographic shift has deepened the professional and institutional infrastructure in the Jupiter and Tequesta submarkets - supporting a buyer base that is increasingly primary-residence-driven rather than seasonal.
What $10M+ Actually Buys: The Variables That Compound
At this price level, the compounding variables are frontage, dock utility, and the boating constraints that determine whether a vessel fits its dock and can reach open water without bridge clearance limits.
How to Price Water: First Principles
Every waterfront acquisition at this level deserves an underwriting framework that weights the variables correctly. These are the six principles that inform a rigorous property evaluation.
Over long horizons, land compounds. Structure depreciates. A 100-ft waterfront parcel at current $/SF is harder to replace than the house sitting on it - and replacement difficulty is what holds value through softer periods.
Draft, beam, and dock geometry determine whether your vessel actually fits the life you bought it for. These variables also drive resale to the next boat-first buyer - and that buyer will run the same checklist.
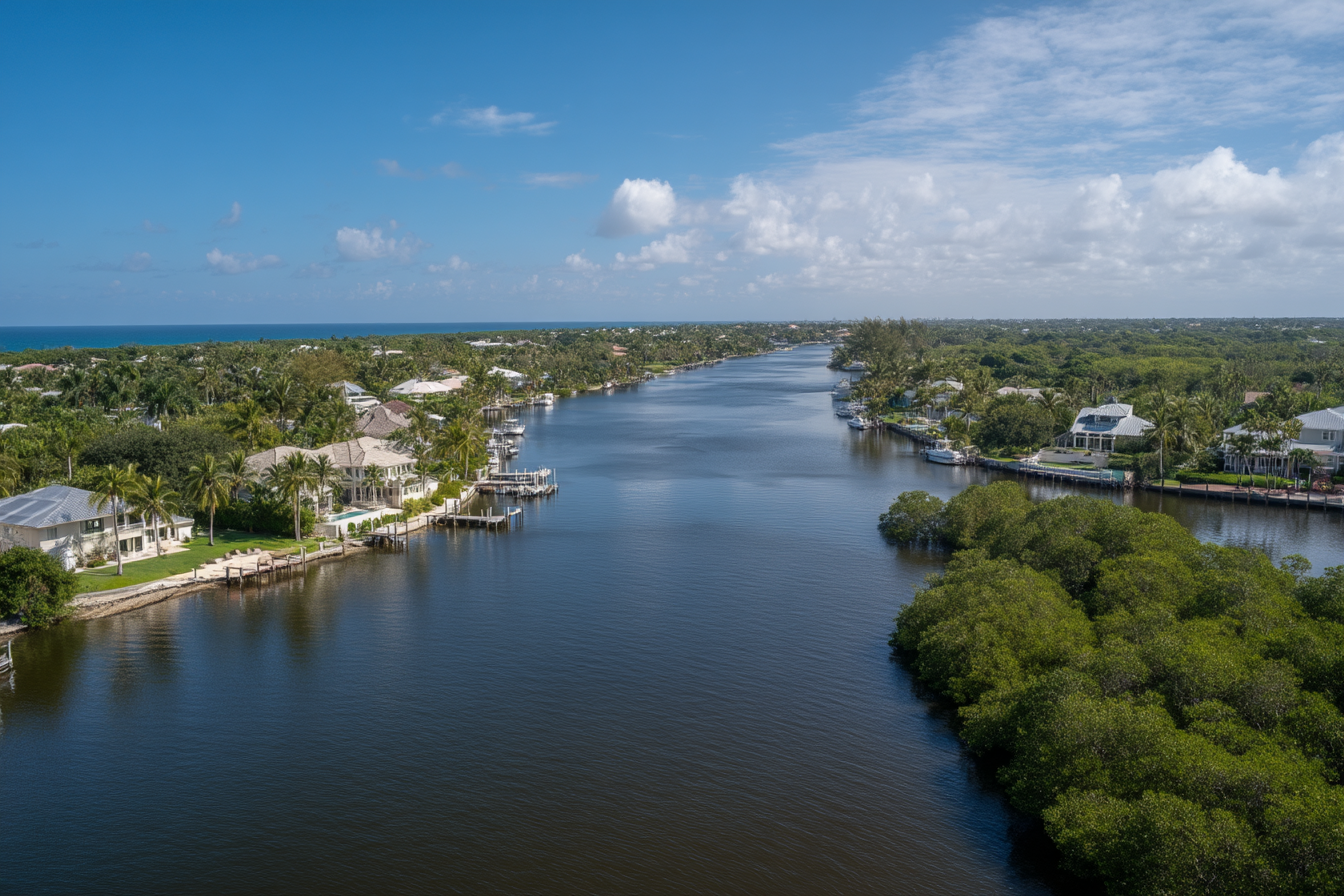
Setbacks and solar orientation determine the quality of light on water across every hour of the day. Morning light on a Loxahatchee River lot reads differently than afternoon light on a bay-facing parcel. Verify orientation before shortlisting.
A 110-ft Intracoastal parcel with inlet access cannot be recreated. Price that scarcity correctly - it is the mechanism that holds value when broader market conditions soften.
Insurance, seawall condition, elevation certificate, and FEMA zone all belong in the purchase price - not discovered in year two as a carrying cost surprise. Obtain carrier pre-quotes before submitting an offer.
Frontage, setbacks, and water depth vary street by street within the same submarket. Confirm every material variable at the parcel level before touring, not after committing to a property.
Case Note: Dock Geometry Decides
A family evaluated two Loxahatchee River properties and one Miami Beach island property at an equivalent price point. The Miami parcel offered approximately 65 feet of bay frontage - sufficient for most configurations, but not for a 40-foot center console paired with the pool program the brief required given the side-yard standards that attach to lots of that width.
The Jupiter parcel at 110 feet resolved the dock geometry, preserved the play lawn, and reduced wake exposure. Once elevation certificates and wind-rated openings were compared on normalized terms, insurance pre-quotes were within range across both locations. The family prioritized daily boat utility and a longer view corridor - both of which the Miami parcel could not deliver at any configuration within its lot geometry.
The transaction closed through a private-first process, avoiding a public bidding cycle. Vessel mapped to dock, insurance pre-quoted, and diligence condensed. They moved with certainty before the property reached the broader market.
Buyer Checklist: Six Decisions Before You Tour
The most costly mistakes in waterfront acquisition happen before the first showing - when the brief is unclear and the constraints are unverified. These six decisions, made before you step on a dock, determine whether you are shopping or positioned to close.
In a multiple-offer situation at this tier, the decisive edge is preparation, not speed. Pre-quotes in hand, marine and structural diligence slots held, and terms that close cleanly: that package consistently outperforms a nominally higher offer from an unprepared buyer.
Six Decisions Before You Tour
Bottom Line
This comparison is a set of trade-offs matched to a specific brief - not a judgment that one market is superior to the other. Both deliver at the $10M level. The question is which set of trade-offs aligns with the life you intend to live.
For buyers whose brief starts with vessel, frontage, and privacy: The Jupiter corridor resolves the waterfront variables more cleanly. Wider frontage produces better dock geometry. Lower density produces a lighter daily cadence. Ocean-to-Intracoastal typologies in Manalapan and Jupiter Island represent a scarcity profile Miami cannot replicate at any price point. The transaction data supports that positioning.
For buyers whose brief starts with global connectivity and cultural infrastructure: Miami delivers what Jupiter cannot. The arts, dining, skyline, and depth of the international buyer pool at exit are compounding advantages for owners who use them. If the brief prioritizes peer network and cultural access over dock utility, Miami is the stronger answer.
Regardless of market: Clarify the brief before evaluating listings. The variables that matter most at this tier - frontage, dock geometry, vessel clearance, daily cadence, and exit liquidity - are all knowable before the first showing. Buyers who answer those questions first make the best long-term decisions.
Jupiter waterfront data: BeachesMLS Area 5040, single-family waterfront residential only. Closed sales Jan 2023 to Feb 2026; 51 transactions at $2M+ and 10 transactions at $5M+. No condos or inland properties included. Active listings used to calculate months of supply only.
Jupiter Island data: BeachesMLS dedicated waterfront SFR pull, single-family only, closed sales Jan 2023 to Feb 2026, 13 transactions. $/SF excludes one sale with an undisclosed address and no recorded square footage.
Miami Beach data: BeachesMLS Q3–Q4 2025 luxury segment reports, defined as the top 10% of market by price. These are segment-level reports and are not directly comparable to the property-level MLS data pull used for Jupiter. Methodology and scope differ; they are presented for directional context, not as equivalent datasets.
Population density: U.S. Census Bureau American Community Survey. Jupiter: 2,825/mi²; Miami: 12,284/mi².
Venetian Causeway bridge count: 12 bridges (10 fixed-span, 2 bascule). Source: Miami-Dade County Department of Transportation and Public Works; FDOT District 6 PD&E Study documentation.
Case note: Anonymized transaction. Details have been altered to protect client confidentiality. Frontage figures, vessel type, and outcome are representative of the scenario described; they do not constitute confirmed transaction records.
References to appreciation, cash buyer share, and months of supply reflect BeachesMLS closed data (Jupiter) and luxury segment reports (Miami). These are directional characterizations and should not be applied to individual property underwriting without a direct MLS comp analysis.
BeachesMLS Area 5040 closed sales data, Jan 2023 to Feb 2026. Single-family waterfront residential only.
BeachesMLS Q3–Q4 2025 luxury segment market reports. Top 10% of market by price. Miami Beach SFR and condo segments reported separately.
U.S. Census Bureau, American Community Survey. Population density figures for Jupiter, FL and City of Miami, FL.
Miami-Dade County Department of Transportation and Public Works. Venetian Causeway bridge inventory. FDOT District 6 PD&E Study documentation.
Palm Beach County Natural Areas Program. Protected land acreage figures.