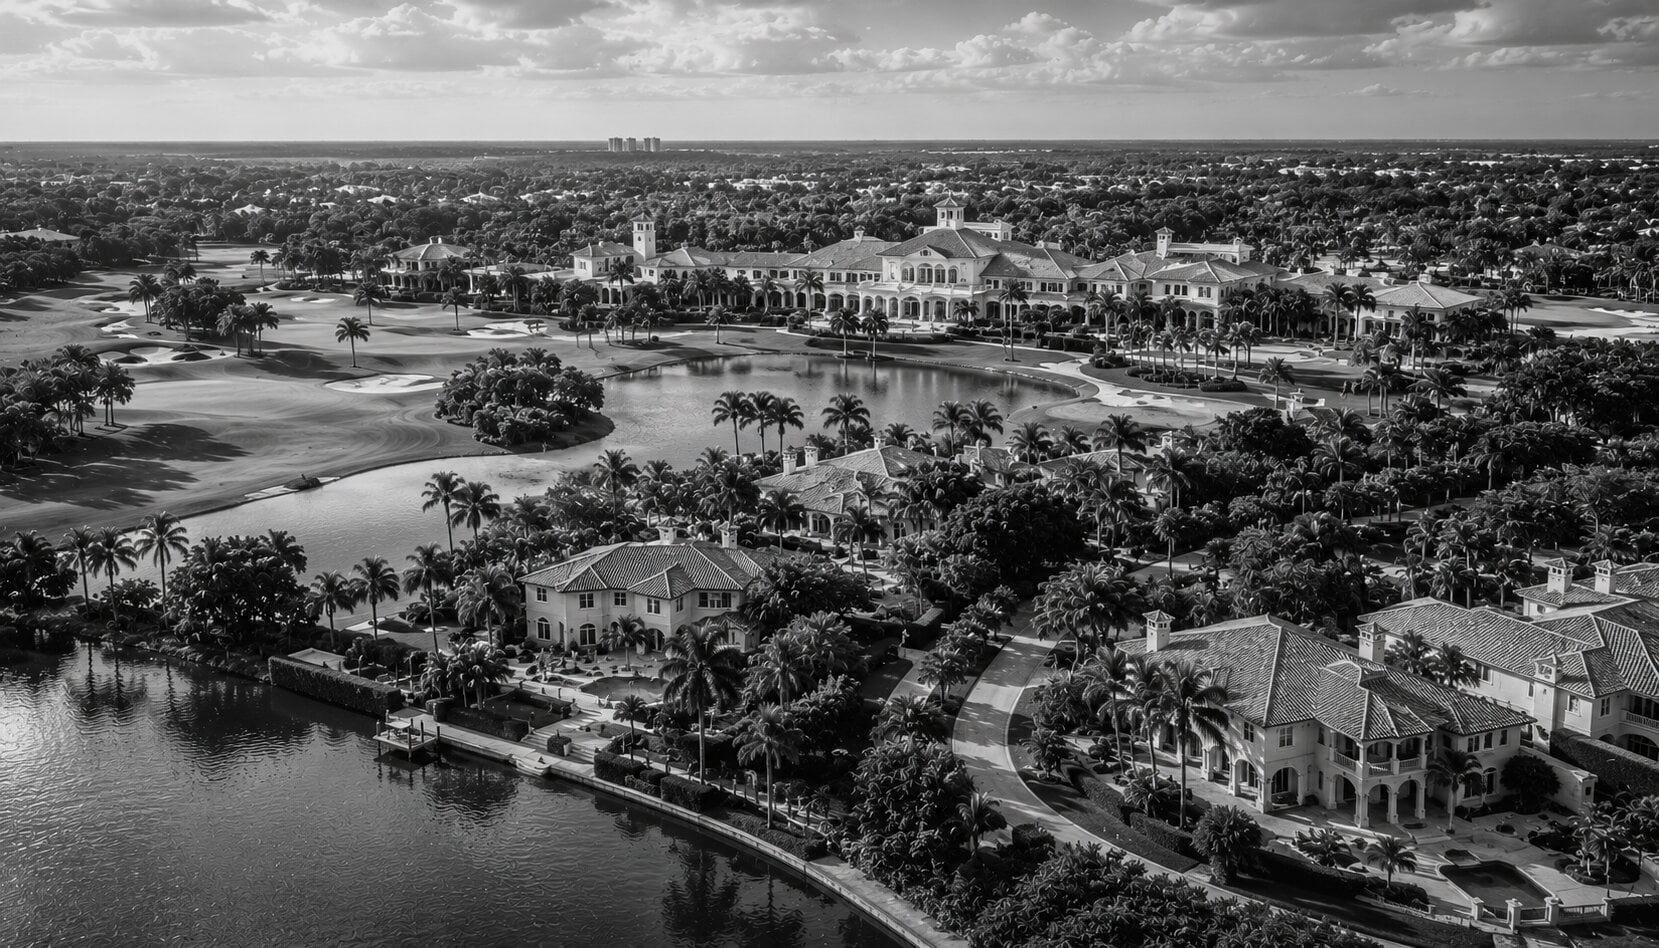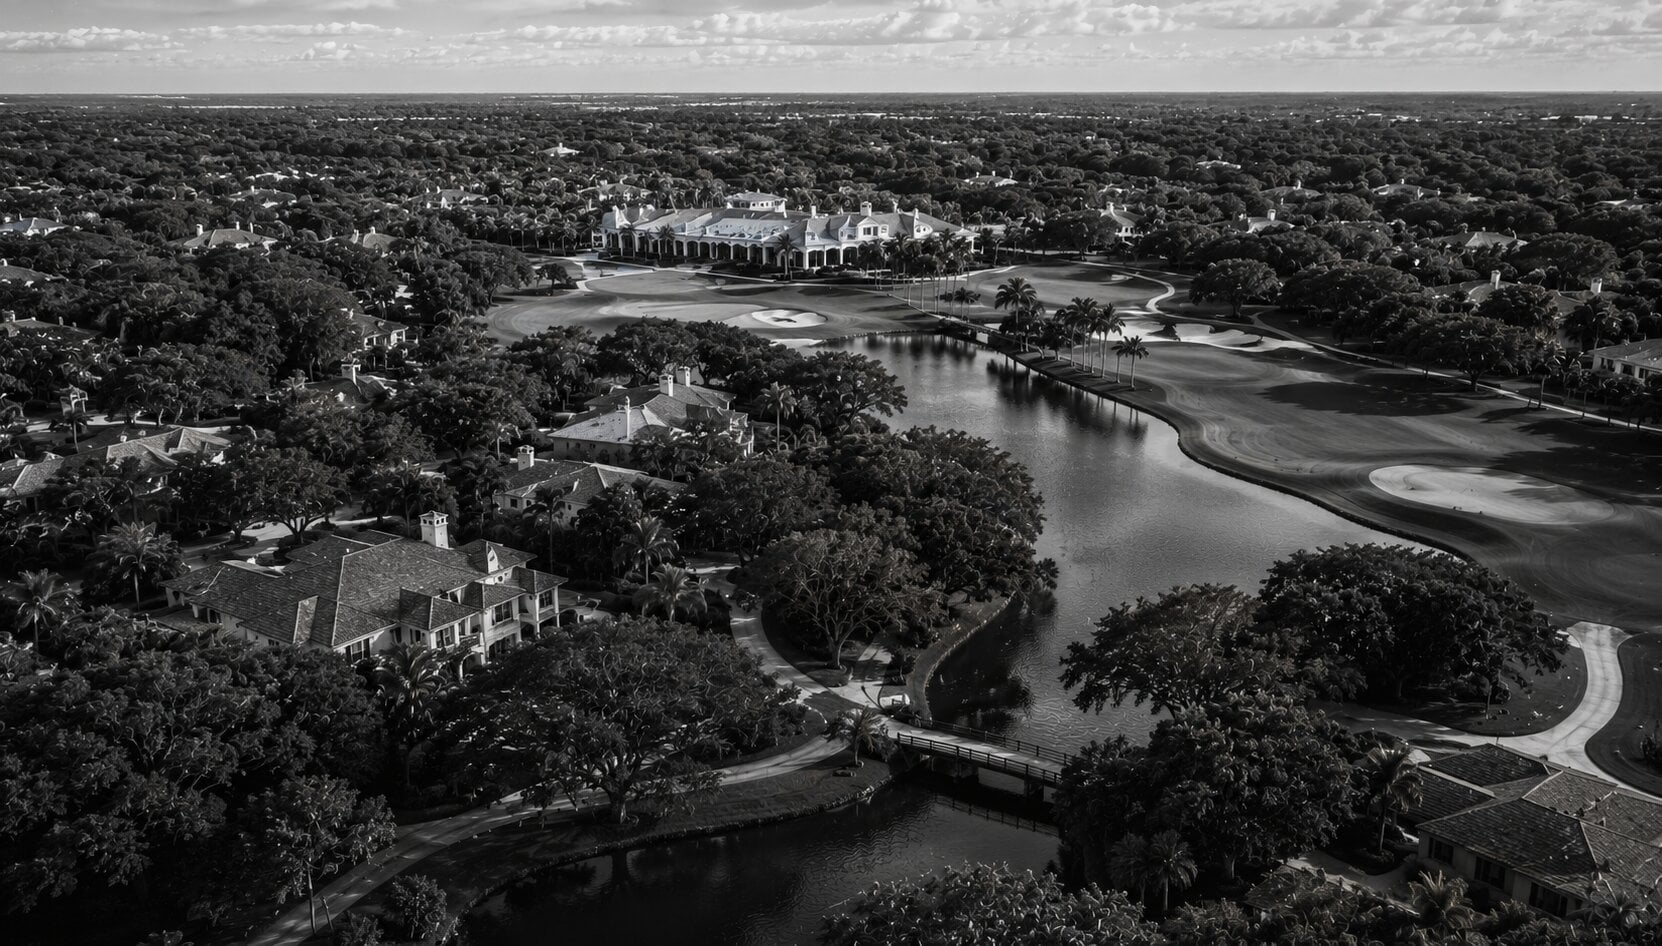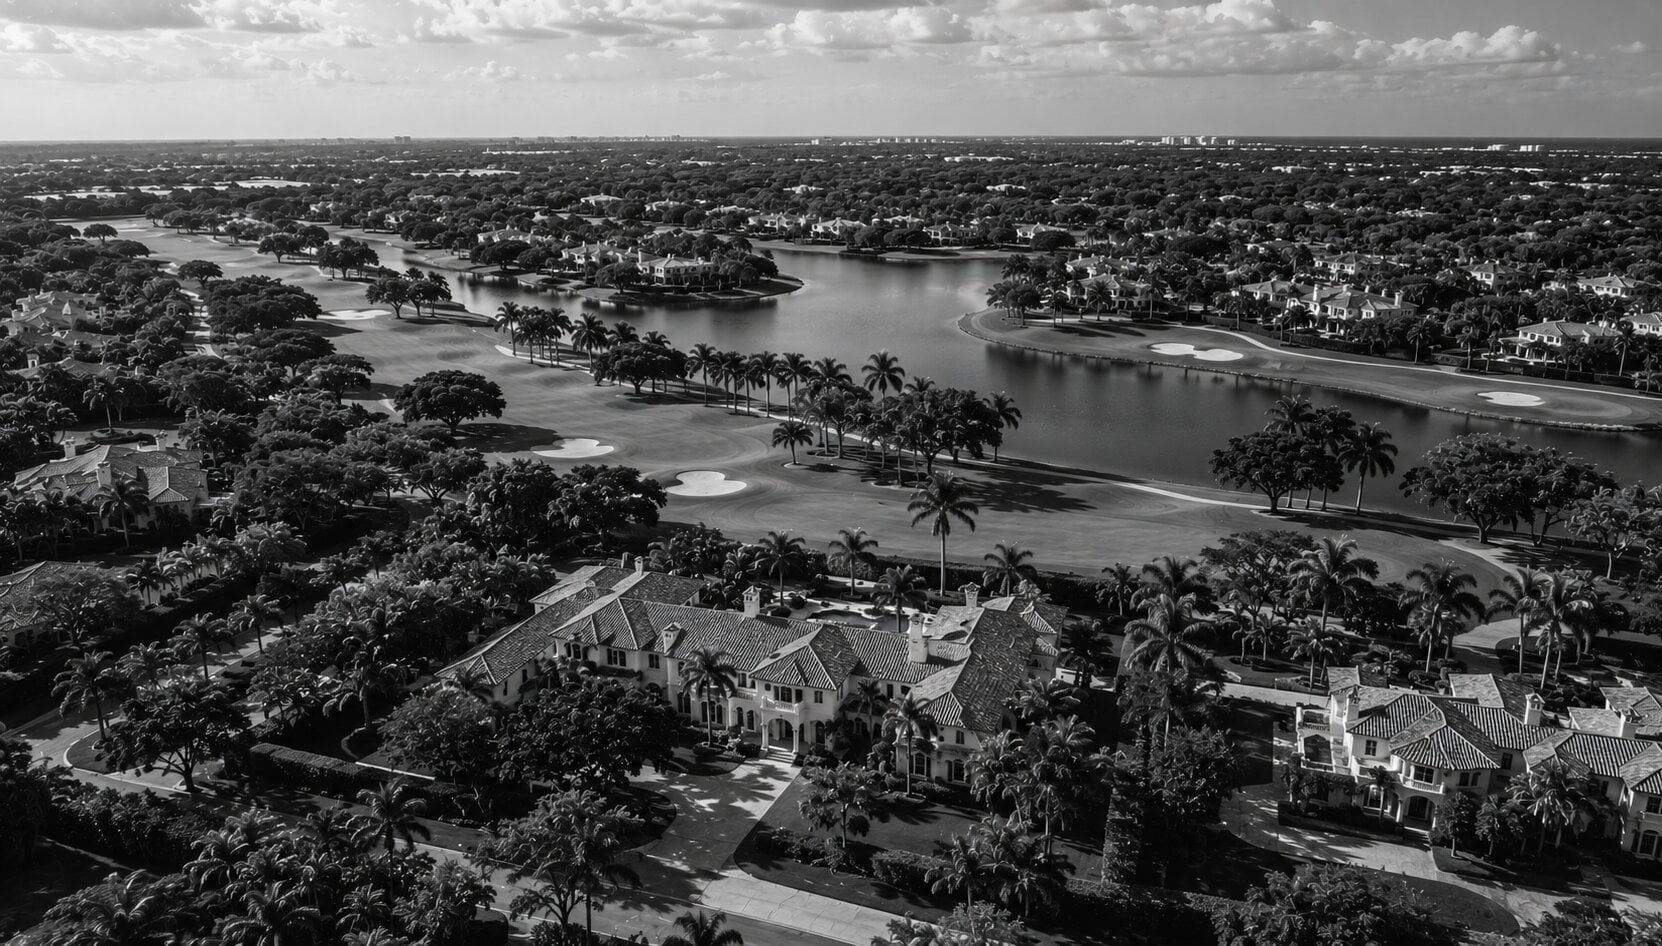
The analysis draws from 162 closed residential transactions in Old Palm Golf Club, sourced from BeachesMLS via Spark API, spanning January 2020 through March 2026. For each sale, we track closing price, price per square foot, days on market, list-to-sold ratio, financing method, home size, lot acreage, build year, and property type. All 162 transactions are single-family estates on a community of approximately 300 lots.
The Appreciation Trajectory: $524/SF to $1,101/SF
Old Palm's median price per square foot has moved from $524 in 2020 to $1,101 across the 2024 to 2025 period, a gain of 110%. Early 2026 (three closings) is running at $1,177/SF. The appreciation has been strong by any measure, but it is worth placing in corridor context: Loxahatchee Club appreciated 186% over the same period, and Old Marsh gained 163%. Old Palm's lower starting point ($524/SF in 2020 versus Loxahatchee's lower base) partially explains the gap, but the community's larger inventory (300 lots versus 60 at Old Marsh) also moderates per-square-foot acceleration. More supply means more price diversity in any given year.
Old Palm Golf Club, 162 closed sales, January 2020 through March 2026
For corridor context: Loxahatchee Club appreciated +186% and Old Marsh +163% over the same period. Old Marsh is a 60-home community where scarcity amplifies price gains directly. Loxahatchee, at roughly 285 homes, is closer to Old Palm in scale but appreciated faster from a lower 2020 base ($394/SF versus Old Palm's $524/SF). Old Palm's +110% reflects its broader price band and deeper inventory.
Source: BeachesMLS via Spark API. Bar height = median $/SF. Label above = closed sales.
The chart reveals the appreciation pattern: a sharp step up from $524 (2020) to $736 (2021), then a second step to $1,124 (2022) where pricing crossed the $1,000/SF threshold. Since 2022, $/SF has held in the $1,000 to $1,200 range without retracing. The 2023 figure ($1,221) is the highest single-year median, but on only 8 sales; the 2024 to 2025 combined figure of $1,101 on 35 sales is the more reliable current-market benchmark. The practical read for sellers: the repricing from pre-pandemic levels is locked in. For buyers: the entry point has moved, and the $524/SF market of 2020 is not returning.
Sales Velocity by Year: The Cycle in Seven Rows
The yearly sales data tells the full market cycle. In 2020, 44 sales closed at above-average volume, reflecting a combination of normal activity and early pandemic-era relocations at pre-appreciation pricing. The 2021 surge (56 sales) was the most active year for any club in the PBG corridor, as pent-up demand collided with limited inventory and pushed pricing from $736/SF into the four-figure territory by year's end. By 2022, velocity compressed to 16 sales, but those transactions were extraordinary: 4-day median DOM, 98.9% list-to-sold, and 94% cash. Homes sold immediately at or above ask.
Since 2023, the market has normalized. Volume has stabilized at 8 to 19 sales per year, DOM has lengthened to 78 to 148 days, and list-to-sold ratios have settled in the 91% to 93% range. This is not weakness; it is a market that repriced and then found equilibrium. At the 2025 pace of 19 sales (roughly 1.6 closings per month), and with active inventory typically in the single digits, the implied absorption rate is approximately 3 to 5 months of supply. That is a balanced-to-tight market by institutional standards: under 3 months is a seller's market, over 6 months favors buyers. Early 2026 (three sales, 8-day DOM, 96.4% L/S) suggests the spring market may be tightening further, though the sample is too small to confirm a trend.
Source: BeachesMLS via Spark API. Median values per calendar year. DOM = days on market. L/S = list-to-sold ratio.
Build Era Breakdown: Where the Premium Lives
Old Palm's housing stock clusters in two construction eras, and the pricing gap between them is one of the most actionable data points in this report. Homes built between 2000 and 2009 (78 sales) carry an all-time cohort median of $3.48M at $604/SF. Homes built between 2010 and 2019 (82 sales) carry a cohort median of $5.45M at $790/SF. That is a 31% premium per square foot for the newer cohort. The two post-2020 sales closed at $12.22M median and $1,519/SF, but the sample is too small to draw conclusions beyond confirming that new construction commands a significant premium.
An important caveat: these are cohort medians across the full six-year dataset, blending $300 to $500/SF transactions from 2020 with $800 to $1,200/SF transactions from 2024 and 2025. A 2005-built home selling in today's market does not trade at $604/SF; it trades at current-market rates adjusted for condition, renovation status, and lot position. The cohort medians quantify the structural premium for newer construction. They are not listing-price guidance for a seller in 2026.
Source: BeachesMLS via Spark API. Build year per MLS records.
The renovation math behind the "value entry." A 2004-built estate at $3M is not a $3M commitment. A comprehensive renovation on a 6,000 to 7,500 SF home typically runs $500,000 to $1.5M depending on scope: roof replacement, impact windows, kitchen and bath upgrades, pool resurfacing, HVAC and electrical systems. Total project cost at $3.5M to $4.5M plus the $350K membership is still below the 2025 median of $5.15M for a move-in-ready home. But the buyer who budgets only the purchase price will be surprised by the scope of work required to bring a pre-2010 estate to current standards in this corridor.
For sellers of pre-2010 homes, the build era data frames the listing decision clearly. An unrenovated 2005-built estate competes against a pool of similar product at $604/SF. A well-renovated version of the same home moves into the 2010s cohort pricing range at $790/SF or higher, depending on the quality of the work. The renovation investment can shift a home from the entry tier into the core market, which is where the majority of Old Palm demand concentrates.
The $10M+ Segment: 15 Transactions
Fifteen Old Palm sales have closed above $10M since 2020, representing 9% of all transactions and confirming the community's ability to attract ultra-luxury capital. The segment's profile is distinct: median home size of 14,201 SF (nearly double the community median of 7,352 SF), predominantly 2007 to 2017 construction, and a $/SF range from $737 to $2,330. The $22.5M ceiling (July 2022) remains the community record.
The timing distribution is notable. Four of the 15 transactions occurred in 2021, six in 2022 (the year of peak velocity across the corridor), and five since then: one in 2023, three in 2024, and one in 2025. The continued activity at this level, even as the broader market normalized, suggests sustained demand at the top end. The most recent, a $10.70M sale in February 2025 at $1,433/SF for a 2011-built 9,045 SF estate, establishes the current floor for the ultra-luxury tier.
Source: BeachesMLS via Spark API. DOM = days on market from list to contract.
The core market is $3M to $10M, not $10M+. The 15 ultra-luxury transactions demonstrate that Old Palm can compete at the top of the corridor, but 91% of all sales close below $10M. The $3M to $10M range (65% of transactions) is where the community's pricing power, liquidity, and buyer depth are strongest. Buyers and sellers in this core range benefit from far more comparable data than the $10M+ segment, where each transaction is essentially bespoke.
Days on Market and Pricing Efficiency
In 2025, the median days on market at Old Palm was 94. In 2024, it was 148. Both figures are above the six-year historical median of 76 days and reflect a market where buyers are taking longer to evaluate and negotiate at the $5M+ price point. The 2022 market (4-day DOM, 99% L/S) was an anomaly driven by extreme scarcity and pandemic-era demand; that velocity has not returned and should not be used as a benchmark for current expectations.
The 2025 list-to-sold ratio of 93.0% indicates buyers are closing at roughly 7% below asking price. In 2024, the ratio was 91.1%. For sellers, this means the current market supports moderate negotiation but not dramatic discounts. The 2024 data is consistent with a pricing accuracy problem: several transactions with 100+ days on market and L/S ratios below 90% suggest initial list prices that required reductions before the market responded. Early 2026 closings at 96.4% L/S and 8-day DOM suggest the spring market is tighter, with sellers pricing more accurately and buyers competing more actively.
One structural observation worth noting: at 95% cash in 2025 (and 87% across the full dataset), Old Palm is largely insulated from interest rate movements. Rate-driven repricing, which has affected financed markets across South Florida, has limited transmission into a community where fewer than one in ten transactions involve a mortgage. For a family office or high-net-worth buyer evaluating long-term hold risk, this cash dominance reduces the probability of a rate-induced correction in the community's pricing.
At 93.0% list-to-sold in 2025, Old Palm sellers are leaving roughly 7% between list and close. Bears Club sellers leave more (89.1% L/S, or 11% between list and close). Admirals Cove sellers leave less (95.5% L/S, or 4.5%). The practical implication: Old Palm sellers who price within 5% of where the market will close are selling in under 90 days. Sellers who price 10% or more above market are waiting 120+ days and eventually taking a larger discount than they would have at a sharper initial price. The data rewards accurate pricing over aspirational listing.
Old Palm vs. the Corridor: Where $1,101/SF Sits
The PBG address question runs through every Old Palm buying decision: is the 26% discount to Bears Club a reflection of lower product quality, or a function of address and exclusivity? The data does not fully resolve this, but it frames it precisely. Old Palm at $1,101/SF delivers a 7,352 SF median home on 0.46 acres. Bears Club at $1,484/SF delivers a larger home (median around 13,000 SF) on a significantly larger lot (1.19 acres) in a 46-home community. Lost Tree at $1,673/SF carries a Jupiter Island-adjacent address with waterfront access. These are different products at different price points, not a linear ranking of the same product.
46 estates on a Nicklaus design in Jupiter. The exclusivity premium is real: fewer lots, larger acreage (1.19 ac median), and a Jupiter address. The 26% gap to Old Palm reflects lot count, location, and the Nicklaus brand. Bears Club L/S is 89.1%, indicating more negotiation room at higher absolute prices.
A Jupiter corridor community with oceanfront and Intracoastal access. The $/SF premium over Old Palm (52%) reflects waterfront proximity, not just golf. Lost Tree serves a different buyer: one who prioritizes water access alongside the club lifestyle. The product types also differ, with condo and cottage inventory alongside single-family estates.
A Nicklaus design with roughly 285 homes in Jupiter. At $872/SF, Loxahatchee trades below Old Palm despite the Jupiter address. The median home (4,813 SF on 0.30 acres) is significantly smaller. Old Palm's 31% $/SF premium reflects larger homes and lots. Loxahatchee appreciated faster (+186%) from a lower base.
The Bears Club comparison gets the most attention (26% gap, both estate-lot communities), but the Loxahatchee comparison may be more instructive for many buyers. Bears Club is a different market segment: 46 ultra-exclusive lots at $1,484/SF. Loxahatchee is a closer structural peer: similar community size (285 versus 300 lots), both are championship golf communities, and both draw from overlapping buyer pools. Old Palm at $1,101/SF versus Loxahatchee at $872/SF raises a different question: is the larger home (7,352 SF versus 4,813 SF), the larger lot (0.46 acres versus 0.30 acres), and the Raymond Floyd course worth a 26% premium over a Nicklaus course in Jupiter? Which comparison drives your decision depends on whether you are optimizing for address, exclusivity, or square footage per dollar.
Bottom Line
Old Palm's +110% appreciation from $524/SF (2020) to $1,101/SF (2024-25) is strong but not the highest in the corridor, where Loxahatchee (+186%) and Old Marsh (+163%) repriced more aggressively from lower bases. The current market is above $1,100/SF, 2026 YTD is running hotter at $1,177/SF, and the $10M+ segment (15 sales) confirms the community's ceiling well above $20M. The relative value case is real: Old Palm delivers more home per dollar than every corridor peer except Loxahatchee, in an estate-lot format that does not exist elsewhere in PBG at this scale. Whether the PBG address narrows that advantage over time or locks it in is the open question the data cannot yet answer.
For sellers of pre-2010 homes: The build era premium is structural: across all years, 2010s construction trades at 31% more per square foot than 2000s construction. An unrenovated 2005 estate competes within its condition class; a well-renovated version moves into the pricing tier of newer product. In the current market above $1,000/SF, the renovation investment directly shifts your competitive set. Price to the most recent comparable sales in your condition class, not to the cohort average.
For buyers at $5M to $10M: This is the current center of gravity. You are buying into a 95% cash market (2025 rate) with 94-day median DOM. There is negotiation room at 93% L/S, but overplaying your hand will cost you the property. The best-positioned offers are within 5% of asking, all-cash or with proof of funds, and pre-approved through the membership process.
The corridor positioning read: If your primary decision is address, Old Palm at $1,101/SF will always trail Bears Club ($1,484) and Lost Tree ($1,673). If your primary decision is estate scale, Old Palm delivers more home on a larger lot than every PBG peer and most Jupiter peers, at a lower per-square-foot cost. The right question is not "which club is best" but "which equation matches my priorities."
This analysis is based on 162 closed residential transactions in Old Palm Golf Club from January 2020 through March 2026, sourced from BeachesMLS via Spark API. All 162 transactions are single-family estates. Metrics tracked per transaction include closing price, price per square foot, days on market (from list date to contract date), list-to-sold ratio (closing price divided by final list price), financing method (cash or financed), living area square footage, lot acreage, bedroom count, and year built.
Median values are used throughout as the primary central tendency measure. Median is preferred over mean in luxury real estate analysis because it is less sensitive to outlier transactions.
Yearly cohort medians (2020 through 2026 YTD) represent the median value of all transactions closing within that calendar year. The "2024-25" combined figure uses all 35 sales from both calendar years. Build era cohorts group transactions by the year the home was originally constructed, not by the year of sale.
The dataset includes two entries for a $12.20M transaction at 16,600 SF (April 2021, year built 2008) with different DOM figures. These appear as separate MLS records and are included as reported. This may reflect a dual-listing or a recording anomaly. Both entries are counted in the 162-sale total and the $10M+ segment.
Corridor comparisons (Bears Club, Lost Tree Village, Loxahatchee Club, Old Marsh, Admirals Cove) use the same BeachesMLS dataset and methodology applied to each community's closed sales over the same 2020 to 2026 period. Recent $/SF figures (labeled "2024-25") use the same combined two-year methodology for consistency.
References to appreciation percentages compare the 2020 yearly median $/SF to the 2024-25 combined median $/SF. These are directional characterizations based on median values, not formal appraisals. Individual property appreciation will vary by location within the community, build year, renovation status, and lot characteristics.
Transaction Data: BeachesMLS via Spark API. 162 closed residential sales in Old Palm Golf Club, January 2020 through March 2026. Accessed March 2026.
Comparative Market Data: BeachesMLS via Spark API. Closed sales data for Bears Club, Lost Tree Village, Loxahatchee Club, Old Marsh Golf Club, and Admirals Cove over the same period. Used for corridor-level $/SF, DOM, and L/S comparisons.
Property Tax Data: Palm Beach County Property Appraiser records. Effective tax rate calculated from recent closed transactions.