The analysis draws on 398 closed residential sales in Admirals Cove from 2020 through early 2026, sourced from BeachesMLS via Spark API. For each transaction, we track closing price, price per square foot, days on market, list-to-sold ratio, financing method, living area, lot size, year built, and property type. The data is segmented into single family (259 sales) and condo/villa (139 sales), and further by build era and price tier. Where the analysis makes buyer-relevant comparisons, it uses 2024-2025 trailing figures rather than full-period blended medians, which are dragged down by 2020-2021 pricing.
The Community and Its Peer Set
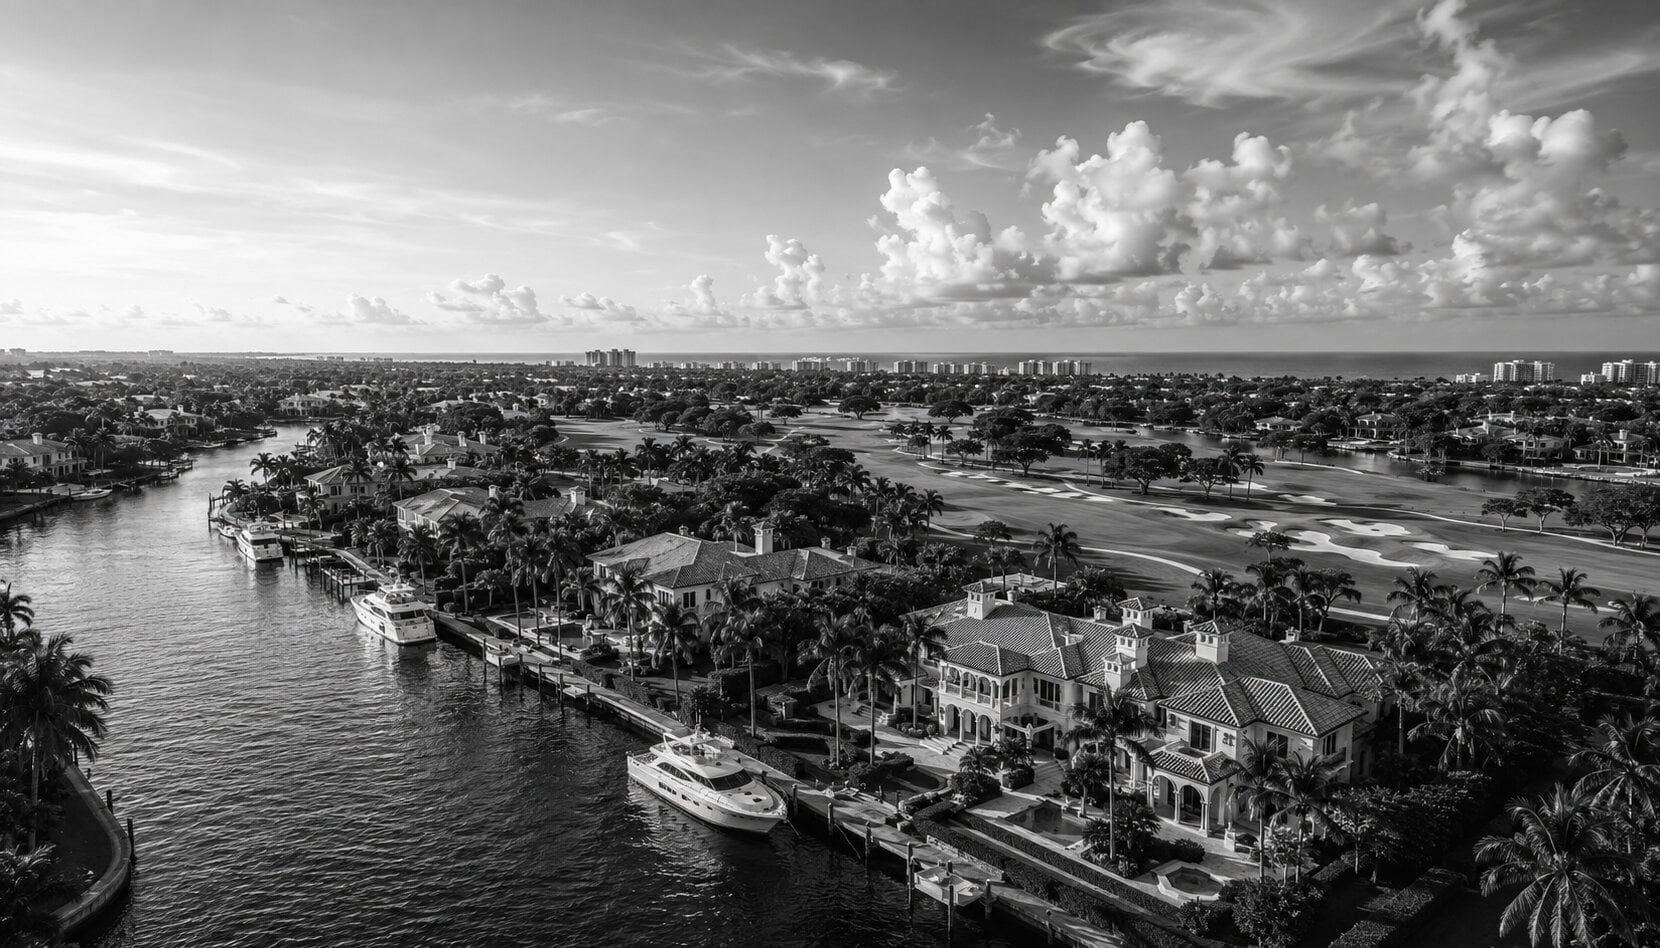
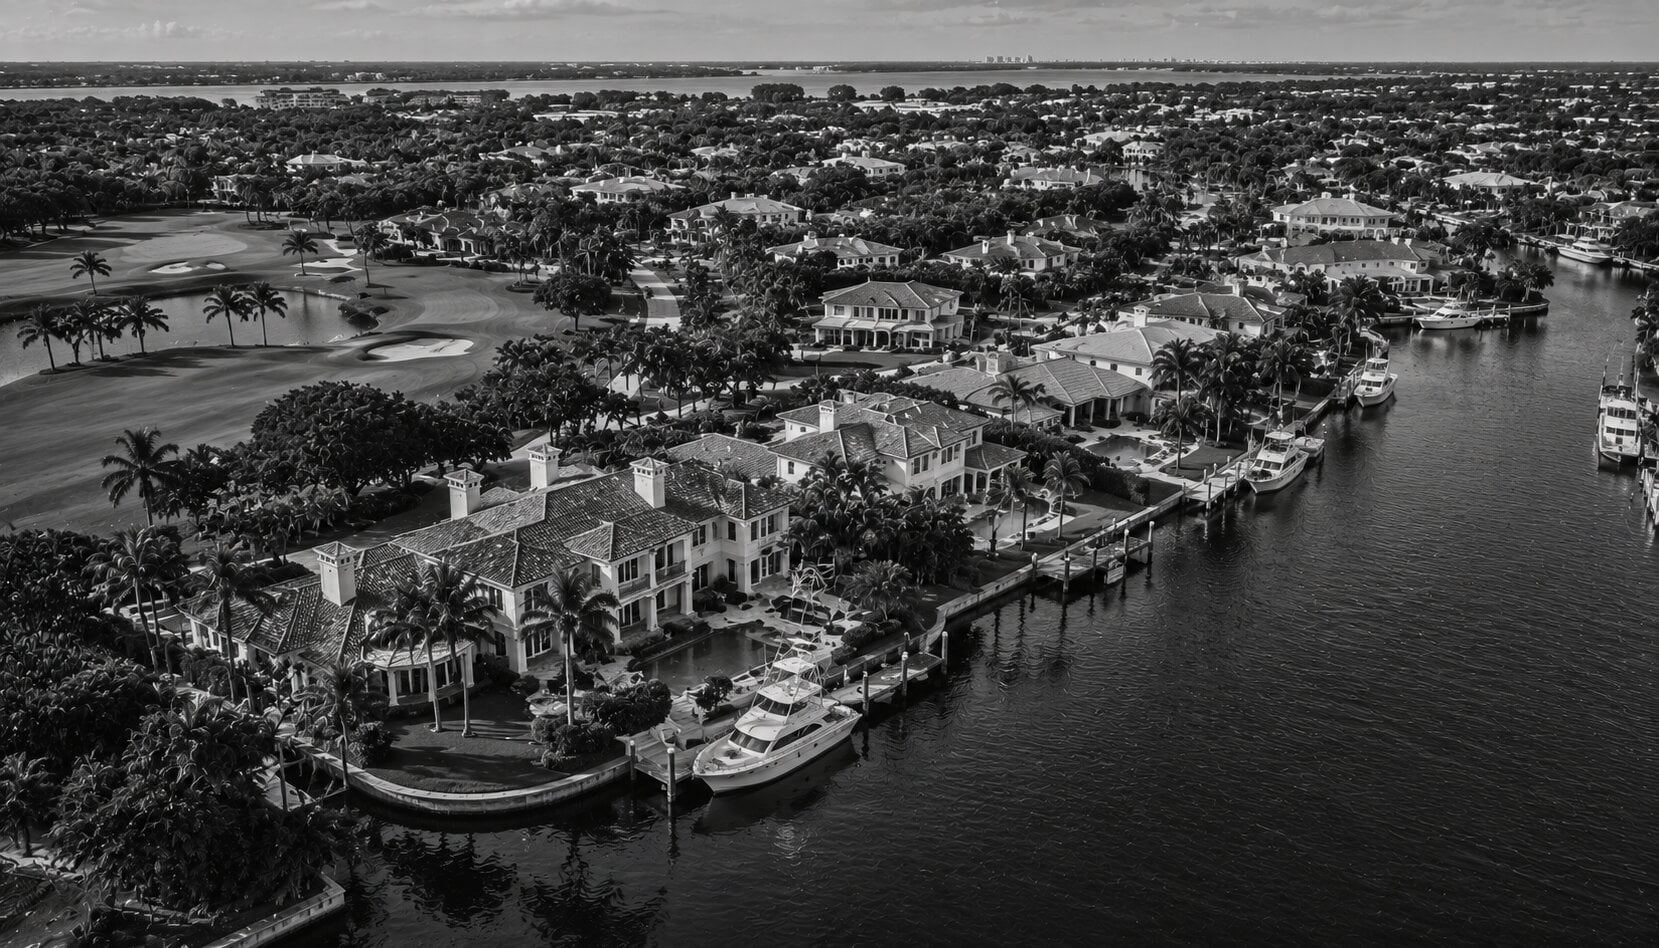
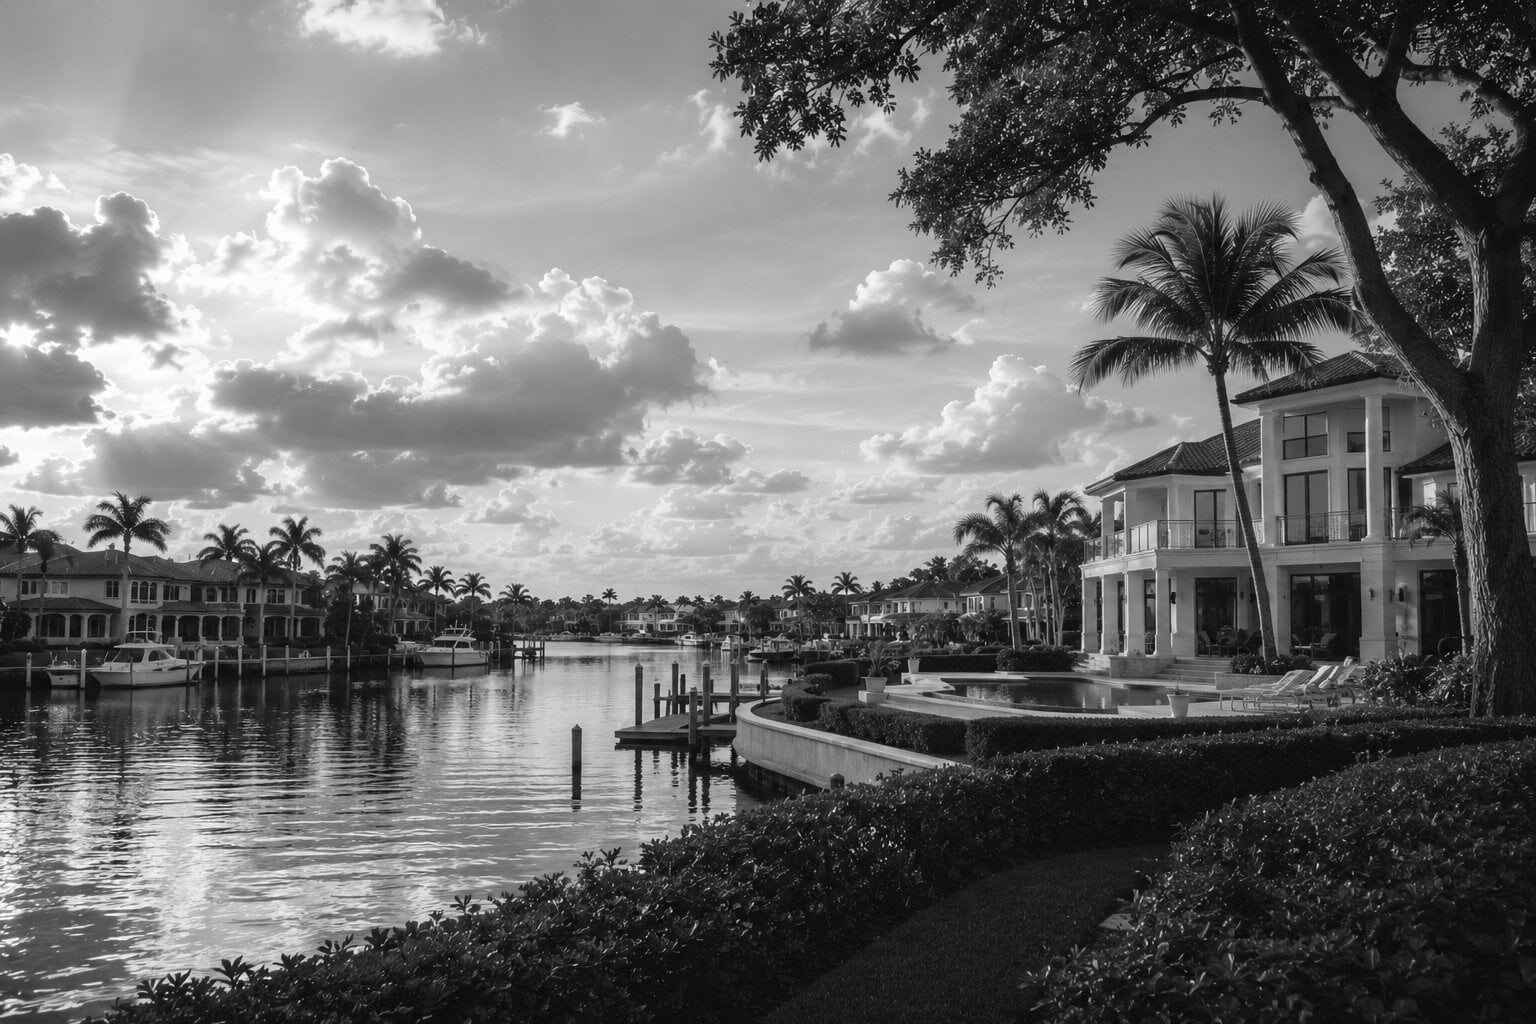
Admirals Cove is a 900-acre gated community on the Intracoastal Waterway in Jupiter, Florida, with 45 holes of golf across three courses, one of the largest private marinas in Southeast Florida (77 slips accommodating vessels up to 110 feet), a racquet club, fitness center, and multiple dining venues. Membership is equity-based; current equity requirements are approximately $250,000-$350,000 with annual dues in the $25,000-$40,000 range plus food and beverage minimums. These are material year-one and ongoing costs that should be modeled alongside purchase price, property tax, and insurance in any total cost of ownership analysis.
The membership demographic skews toward seasonal and full-time residents in their 50s-70s, many of whom relocated from the Northeast and Midwest. The community operates as a self-contained social and recreational ecosystem, which is part of its draw and part of what makes its transaction data comparatively contained: buyers are purchasing a lifestyle package, not just a house.
In the Jupiter and North Palm Beach County peer set, Admirals Cove occupies a distinct position. It trades at a discount to Bear's Club and Old Palm on a per-square-foot basis, but offers marina access that neither competitor can match. Jupiter Island offers oceanfront exposure at a higher price point but without the club infrastructure. Loxahatchee Club is the most direct golf-focused competitor but is smaller and lacks waterfront. Buyers comparing communities should evaluate the full amenity and membership package, not $/SF in isolation. We maintain detailed comparative data across all major gated communities in Palm Beach County.
The New Construction Premium
Over the full 2020-2026 period, 53 new construction single family sales traded at a median $1,296 per square foot versus $1,034 for 206 resale homes: a blended 25% premium. That figure is useful as a baseline but misleading as a guide to the current market. With single family appreciation running at 176% over the period, the 2020-2021 transactions (where NC traded at $930-1,103/SF) pull the all-period median well below where new construction is transacting today.
In 2024-2025, the 12 new construction closings traded at a median $2,050 per square foot and a median price of $13.41M. The 2025 subset alone (7 sales) came in at $2,365/SF and $15.25M. The premium over all single family sales has been running +32% to +39% in 2024-2025, meaningfully wider than the blended 25%.
New construction also carried tighter pricing discipline: the community-wide L/S ratio for NC is 96.2% versus 94.7% for resale. The one metric that consistently cuts against NC is days on market, with a median of 115 days versus 49 for resale, reflecting construction timelines and buyer customization, not weak demand.
Median $/SF by Year
Source: BeachesMLS via Spark API. NC medians from 53 individual SF transactions by closing year. Per-year NC samples are small (5-9); individual bars are directional. "All SF" (259 total) includes NC, which pulls the composite upward.
What the MLS does not show: waterfront position within Admirals Cove. The MLS waterfront field reads 0% for all transactions in this community, a known data-entry inconsistency. In practice, lots with direct Intracoastal or marina-basin exposure command a meaningful premium over interior golf-course lots, typically 15-25% on a per-square-foot basis at comparable build quality. This distinction does not appear in community-wide medians and requires lot-level knowledge of the community. If waterfront position is a priority, we can segment the inventory for you at the individual-lot level.
The Build-or-Buy Math
The yearly NC trajectory makes the comparison with resale more complex than a single median suggests. In 2020, NC homes were closing at $3.88M median ($930/SF). By 2025, that figure reached $15.25M ($2,365/SF). The product entering the market today occupies a fundamentally different price tier from what closed three years ago.
Source: BeachesMLS via Spark API. 53 total NC SF sales, deduped. Per-year samples are small; medians are directional.
A buyer evaluating NC today is looking at a $12.7M to $20.9M price range (the 2025 closed set). The relevant comparison is what a resale purchase plus renovation costs at a comparable quality level in 2025, not the blended all-time medians.
The all-time pre-2000 resale median of $4.40M (145 sales) includes homes that traded in 2020-2021 at $2-3M. Those homes would trade for substantially more today. The overall 2025 SF median (including NC) is $8.50M across 33 sales, of which 7 were NC at $12.7M+. The remaining 26 resale closings carried a lower median. A reasonable directional estimate for a renovatable pre-2000 home in 2025 is $7-8M, though actual pricing depends on lot position, condition, and waterfront exposure.
One cohort in the build-era data deserves mention. The 13 homes built in 2018-2019 that traded during this period carried a median $1,352/SF and 35-day DOM. That rests on 13 transactions (a single outlier can move the median by $100+/SF), but the directional finding is consistent: recently completed homes absorb faster and trade at or above NC pricing. These homes are now 6-7 years old and holding value, which suggests NC purchased today should retain its per-square-foot premium as it seasons. The premium paid at purchase may not be the premium given up at exit.
At 2025 pricing, a buyer considering NC at the median ($15.25M) would model a resale-plus-renovation path at roughly $7-8M purchase plus $3-4M renovation plus $200K-350K in carrying costs during 12-18 months of construction: a total of approximately $10M-12.5M. The gap between the two paths is $3M-5M at the midpoint.
The ongoing cost differentials partially close the gap. Property taxes favor Path B by roughly $130K-150K per year (assessment at $7-8M vs. $15.25M at an effective rate near 1.8%). Over a 10-year hold, that totals $1.3M-1.5M. Insurance works in the opposite direction: new-code construction typically insures for $35K-50K per year versus $55K-80K for pre-2000 homes. The differential is $20K-30K annually, or $200K-300K over a decade. Membership equity and annual club dues are the same regardless of which path you choose.
Net, the resale-plus-renovation path offers a $3M-5M purchase-price advantage that the property tax differential widens by another $1M+ over a decade. The new construction path offers certainty, no construction risk, and lower insurance. A 20% construction overrun on a $3.5M renovation adds $700K, bringing the Path B total to roughly $11M-13M; the gap narrows but does not close at 2025 pricing.
Construction overrun risk is real but does not close the gap at 2025 pricing. Unlike under the blended all-time figures (where the two paths appeared to converge), the 2025 NC median ($15.25M) sits far enough above the fully loaded renovation path ($10M-12.5M) that even a worst-case overrun scenario leaves a $2M+ spread. The tradeoff is 12-18 months of timeline and execution risk, not dollars.
What the premium buys is not additional size. NC homes have a median living area of 7,500 square feet; resale homes have 7,359. Both clusters center on 4-5 bedrooms. The difference is specification: impact-rated windows and doors to current code, zone-controlled HVAC, a fully engineered roof built to the latest wind load requirements, an electrical panel designed for generator integration, commercial-grade appliance packages, and interior finishes built to 2020s luxury standards. These specifications directly affect the insurance differential ($20K-30K/yr) and eliminate deferred capital expenditure at move-in.
Resale homes built before 2000 (145 of 206 resale transactions over the full period) will typically need window replacement, roof work, HVAC upgrades, and electrical modernization within the first years of ownership. Those costs are real but are captured in the renovation budget line ($3-4M) of the Path B model above, not an additional hidden expense.
Lot sizes favor resale. Resale homes carry a median lot of 0.48 acres versus 0.42 for NC. Many of the original Admirals Cove lots, platted in the 1980s and 1990s, were larger than the parcels available for recent teardown-rebuild projects. Lot size data does not distinguish waterfront position; Intracoastal-exposed lots carry a premium not reflected in the median.
How the Market Has Evolved, 2020 to 2025
Single family homes traded at a median $651 per square foot in 2020. By 2025, that figure reached $1,797: a 176% increase. Median price rose from $3.55M to $8.50M over the same period.
The drivers behind this trajectory are largely structural, not speculative. Post-COVID migration from high-tax states (particularly New York, New Jersey, Connecticut, and Illinois) created sustained demand for gated golf communities in South Florida. Florida's lack of state income tax compounds the migration incentive. Construction cost inflation has reduced the pipeline of new supply, particularly in land-constrained communities where teardown-rebuild is the only path to new inventory. And the insurance crisis across South Florida, while raising carrying costs, has also concentrated buyer demand in newer, code-compliant homes that command lower premiums.
Volume peaked in 2020 and 2021 (65 and 54 single family sales), then settled into 28-45 annual transactions from 2022 through 2025. The market compressed on the supply side while prices continued to climb. DOM peaked in 2020-2021 (80-82 days), dropped to 38 in 2022, and has oscillated between 42 and 75 since.
The condo and villa market followed a steeper trajectory in percentage terms, though from a meaningfully lower base. Median $/SF went from $328 in 2020 to $1,098 in 2025: a 235% increase. The 2020 starting point ($690K median, $328/SF) reflected aging product with limited recent activity; much of the gain came from repricing off that depressed base, not sustained compounding. Condos remain a faster-absorbing product, with a community-wide 23-day median DOM versus 60 for SF.
Source: BeachesMLS via Spark API. 259 single family sales. Includes new construction.
Whether these drivers sustain the current pricing level depends on continued migration demand, construction cost trends, and insurance market stabilization. The structural supports (no state income tax, limited supply in gated communities, aging inventory requiring replacement) remain in place. But the rate of appreciation has already decelerated from the 2020-2022 surge, and buyers at 2025 pricing should model for price stability rather than continued 20%+ annual gains.
The $10M+ Market
Admirals Cove has recorded 56 sales at $10M and above since 2020. All 56 were single family, and all but one closed in cash. The highest sale was $34M in late 2024 for a 31,369 SF estate built in 2007 on 1.12 acres. The highest NC sale was $20.93M in mid-2025 for a 13,115 SF, 6-bedroom home on 0.54 acres.
At this tier, composition splits between new/recent builds and renovated older estates. Several of the highest $/SF sales (above $2,000/SF) were homes built in the late 1980s and 1990s that had been extensively renovated. A 5,159 SF home built in 1989 traded at $3,877/SF in late 2024 ($12.9M). A 1988-vintage home on 0.83 acres traded at $2,467/SF in early 2023 ($13.75M). At the top of the market, lot position and Intracoastal exposure matter more than construction vintage. The homes that command $3,000+/SF are almost always on the water, regardless of build year.
The $10M+ median L/S ratio is 95.5% across 56 sales, compared to roughly 90% for the PBC composite at this tier. Some of that spread reflects listing discipline within Admirals Cove (sellers price tightly against a contained comp set). The buyer pool at this level is small; when the right buyer appears, the negotiation window is narrow. We track pre-market and off-market inventory in this community, which is often the first opportunity to access these homes.
The Condo and Villa Entry Point
For buyers who want access to Admirals Cove's golf, marina, dining, and social infrastructure without the $6M+ single family price, the condo and villa market offers a different product at a different scale.
The 139 condo and villa transactions since 2020 carried a median price of $1.82M and a median 2,855 SF, typically 3 bedrooms. The median $/SF was $837, roughly 24% below the SF median of $1,098. DOM: 23 days versus 60 for SF. L/S: 95.7%. Cash rate: 91%.
Condo pricing went from $328/SF in 2020 to $1,098/SF in 2025: a 235% increase. The scale of that gain is a function of the depressed 2020 starting point; the sub-$1M inventory has cleared and remaining product has repriced to the community's broader valuation. This is a repricing event, not a growth rate to extrapolate.
SF HOA fees carry a median of $826/month. Condo and villa fees are more than double at $1,678/month ($10,200/yr differential). Beyond the monthly fee, condo buyers in Florida must evaluate reserve adequacy and structural compliance. Senate Bill 4-D requires condominium buildings 25 years and older (or 3 stories and above) to complete milestone structural inspections and maintain funded reserves. Non-compliant associations face special assessment risk. In the current Florida condo environment, a $100K-$200K+ special assessment within 18-24 months of purchase is not hypothetical. Request the reserve study, the most recent structural inspection report, and pending assessment disclosures before submitting an offer.
Before You Write an Offer
The data above frames the decision. The checklist below is the diligence that turns a data-informed opinion into a defensible purchase. Most of these steps require access to community-specific information, off-market intelligence, or professional coordination that is not available through public search.
BUYER DILIGENCE CHECKLIST
Bottom Line
At 2025 pricing, the NC premium runs +32% to +39% over all SF sales, wider than the blended 25%. The 2025 NC median is $15.25M; the fully loaded renovation path lands at $10M-12.5M. The $3M-5M purchase-price gap is durable even after a 20% construction overrun. Property taxes favor resale by $1.3M-1.5M over a decade; insurance favors NC by $200K-300K. Membership equity and dues are the same regardless of path. The decision turns on whether a buyer values certainty and immediate occupancy or lower total cost and customization control. Lot position within the community, particularly Intracoastal exposure, affects individual comparisons in ways the community-wide medians do not capture.
For buyers evaluating NC at $12M-16M: The 2025 NC median is $15.25M ($2,365/SF), not the blended $7.70M. Model total cost with $275K/yr property tax, $35K-50K/yr insurance, and $250K-350K in year-one membership equity. If construction risk is unacceptable and you need the home in 2026, this is the path. The 2018-2019 "proven" cohort (35 DOM, n=13) absorbs faster when available.
For buyers modeling the resale-plus-renovation path: Budget $7-8M for the resale purchase (2025 directional estimate) plus $3-4M in renovation plus $200K-350K in carrying costs. The property tax savings ($130K-150K/yr) compounds and is the primary financial advantage. Price the construction risk (15-25% overrun probability in the current market) before committing.
For buyers comparing Admirals Cove to its peer set: Admirals Cove trades below Bear's Club and Old Palm on a per-square-foot basis but offers direct Intracoastal marina access that no other Jupiter golf community can match. If the marina matters to you, this is the only conversation. If it does not, the competitive set is wider. We track pricing, inventory, and membership costs across all major gated communities in Palm Beach County and can run a side-by-side comparison tailored to your priorities.
This analysis is based on 398 closed residential transactions in Admirals Cove, Jupiter, Florida, sourced from BeachesMLS via Spark API. The dataset covers January 2020 through March 2026. Property types: single family (259 sales) and condos/villas (139 sales). New construction is defined as year built 2020 or later.
The dataset contains duplicate entries where the same transaction appears twice with slightly different DOM counts, a Spark API artifact. Transaction counts use deduplicated figures. Aggregate statistics are minimally affected.
Yearly NC medians are derived from individual transactions grouped by closing year. Per-year samples range from 5 to 9 transactions and are directional, not statistically robust. The 2018-2019 build-era cohort (13 sales over the full period) carries the same small-sample caveat.
The MLS waterfront field reads 0% for all Admirals Cove transactions despite the community's Intracoastal frontage. This is a known data-entry inconsistency. Community-wide medians do not distinguish waterfront position. The 15-25% waterfront premium estimate cited in this article is based on practitioner observation across comparable sales in this community, not a formal regression analysis.
The 2025 resale purchase estimate ($7-8M for a renovatable pre-2000 home) is derived directionally from the 2025 SF median ($8.50M, n=33) minus the NC composition (7 sales, all above $12.7M). A precise build-era-by-year crosstab is not available.
Renovation costs ($3-4M for full gut at 2025 pricing), property taxes (~1.8% effective rate), insurance estimates ($35-50K new code, $55-80K pre-2000), and membership cost ranges are practitioner observations. They are directional and should not replace individual quotes. Membership equity and dues are set by the club and subject to change.
All appreciation figures describe realized performance. Past appreciation does not indicate future direction. The 235% condo figure reflects repricing from a depressed 2020 base and should not be extrapolated. The structural drivers section reflects the author's market assessment and is not a forecast.
Transaction data: BeachesMLS via Spark API, closed residential sales in Admirals Cove, January 2020 through March 2026. 398 total transactions.
Association fee data: BeachesMLS listing records, 397 listings with fee data. Fee frequency: 394 monthly, 3 quarterly (converted).
Build era classification: Year-built field in MLS records. "NewBuild" entries classified as 2020+ based on listing date and characteristics.
Cost estimates: Practitioner observation for Jupiter, FL residential properties. Directional for TCO modeling; not sourced from actuarial or tax databases.
Community and membership data: Admirals Cove Club, public disclosures and practitioner knowledge. Subject to change. Verify with the club directly before budgeting.
Gated community comparisons: Palm Beach Luxury practitioner data. See palmbeachluxury.com/gated-communities for community profiles.