The dataset covers all single-family sales in Admirals Cove recorded in BeachesMLS via Spark API from January 2020 through March 2026. For each transaction, we track close price, original list price, last list price, price per square foot, days on market, list-to-sold ratio, lot size, living area, year built, waterfront classification, dock and water access features, and buyer financing type. Sales are segmented by waterfront position (ICW, canal, interior) and by year. Repeat sales at the same address are analyzed separately to distinguish hold-and-resell returns from teardown/rebuild returns. Condo transactions (111 sales) are referenced for context but are not part of the primary single-family analysis. One non-waterfront sale from January 2026 is included; all other sales closed in 2020-2025.
Community Profile and Peer Set
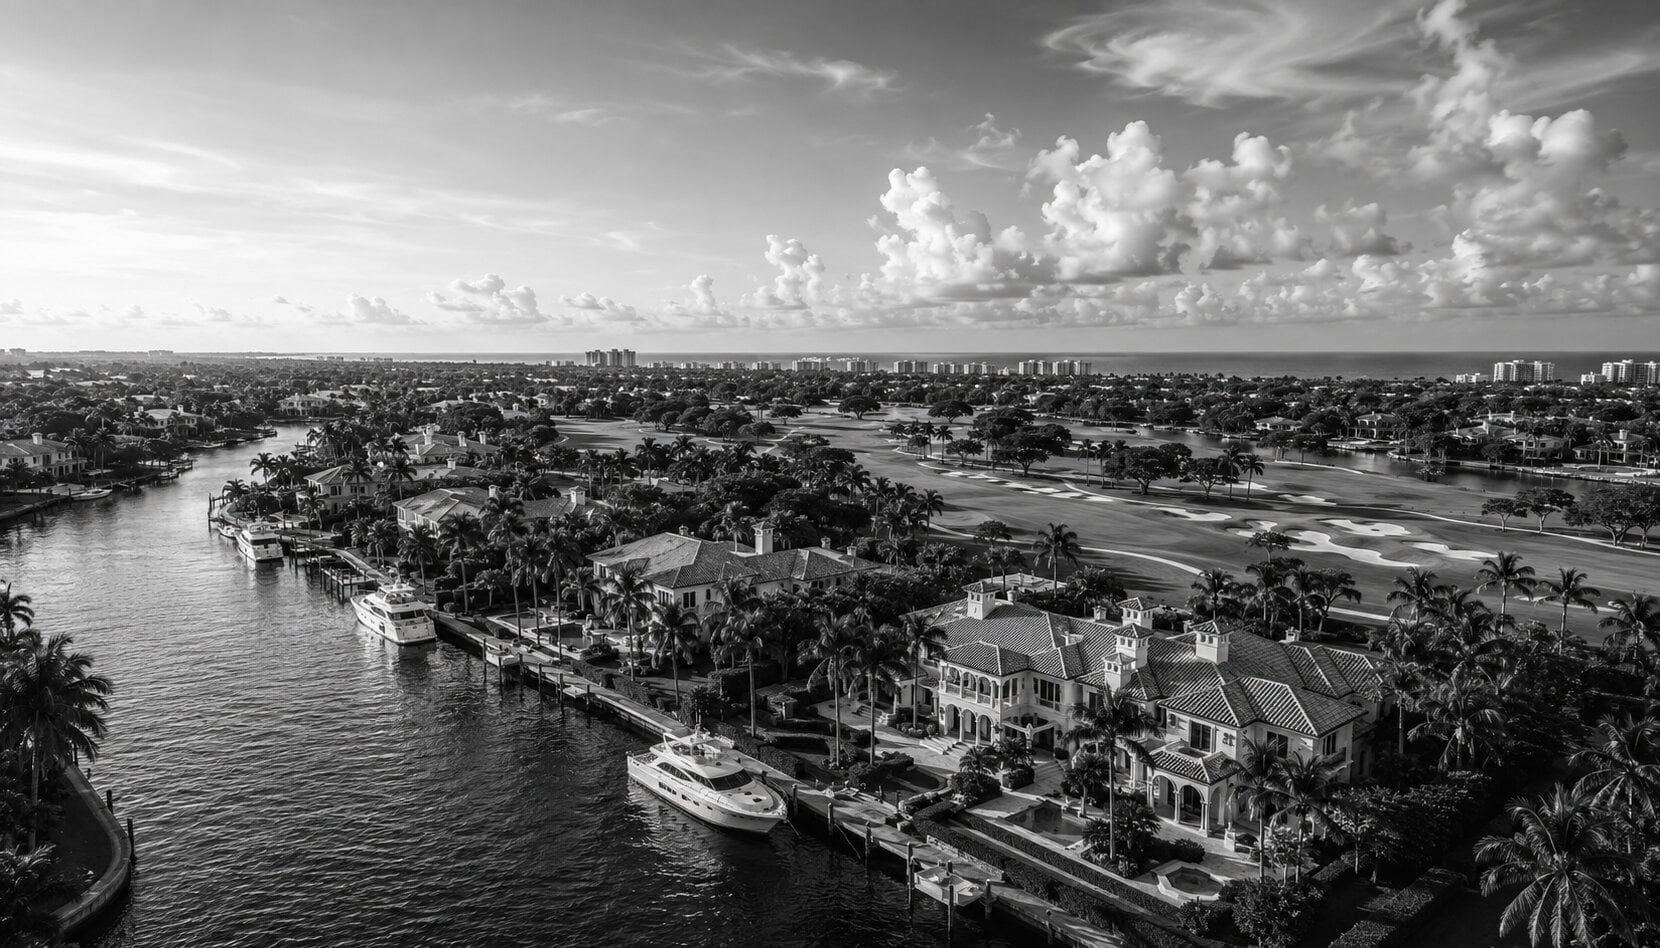
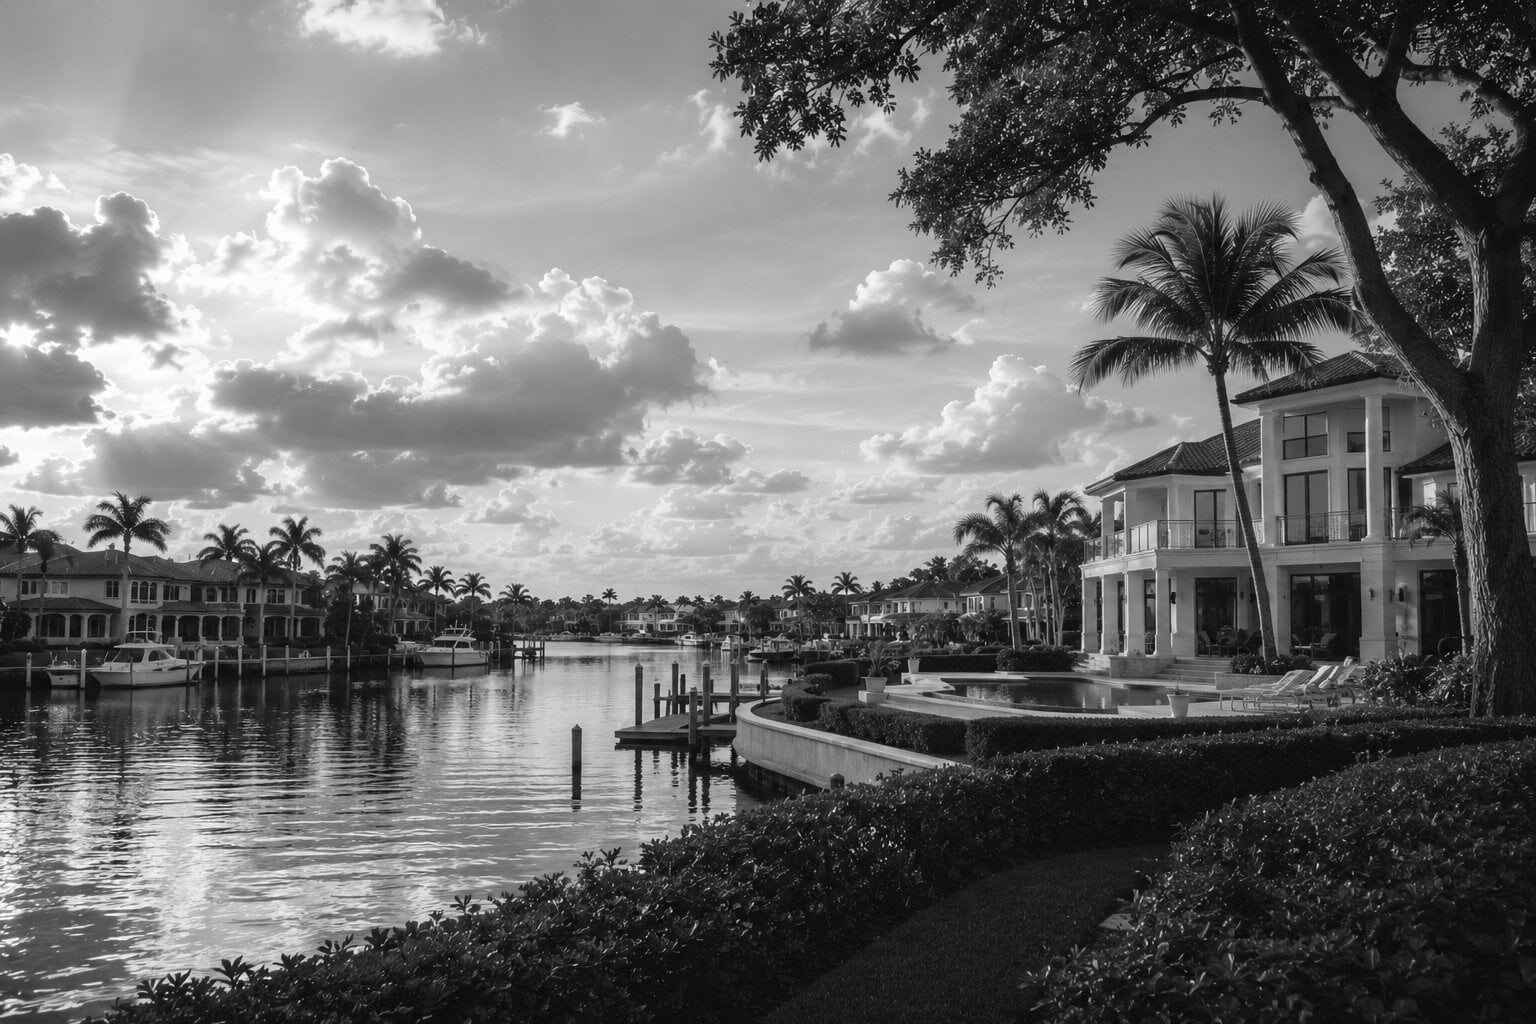
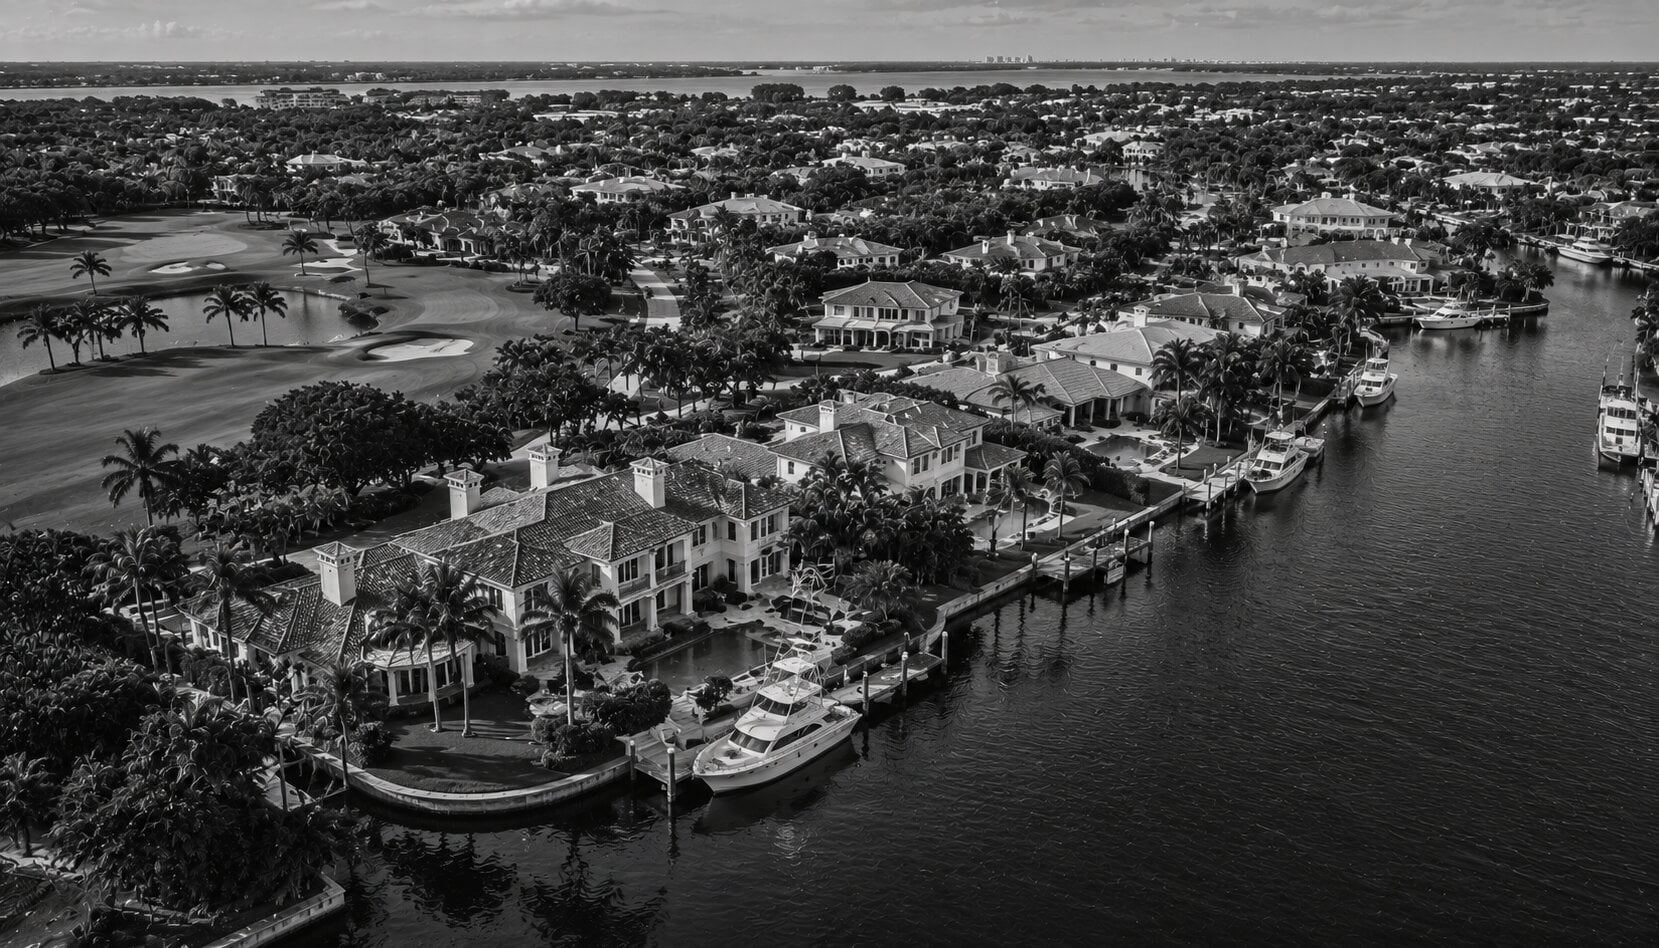
Admirals Cove is a 900-acre gated community on the Intracoastal Waterway in Jupiter, Florida, anchored by a 45-hole golf operation and a 58-slip deep-water marina. Membership is mandatory for all homeowners. The community includes approximately 850 residences across single-family homes, condominiums, and townhomes, with a private yacht club, five dining venues, a full-service spa, and a tennis and pickleball complex.
Among its peers, Admirals Cove occupies a distinctive position. The Bear's Club and Old Palm trade at materially higher $/SF (directionally $2,800-3,200/SF for Bear's Club, $2,500-2,900/SF for Old Palm in recent transactions) but offer neither water access nor docking. Jupiter Island provides superior oceanfront and Intracoastal frontage ($2,500-4,000+/SF depending on position) but has no golf and no club structure. Jonathan's Landing offers water and golf at a significantly lower price tier ($700-900/SF) with older infrastructure. At $1,880/SF trailing for canal front, Admirals Cove prices at roughly 35-40% below Bear's Club while offering marina access that Bear's Club cannot match. For a broader comparison, see our Jupiter Gated Communities Guide.
The Three-Tier Market: ICW, Canal, Interior
Admirals Cove's single-family market segments into three distinct pricing tiers based on water position. In 2024-2025, ICW frontage (n=10) carried a median of $13.45M and $2,143/SF. Canal front (n=32) traded at a median of $12.23M and $1,880/SF. Interior golf-course homes (n=17) held at $3.25M and $1,113/SF. Cash transactions accounted for 93% of waterfront sales and 91% of interior sales across the full dataset.
33 total sales, 2020-2025. Median $10.30M. Median home: 6,690 SF, built 2002, 0.57-acre lot. 40 DOM (2024-2025). Only 1 ICW sale in 2025 (at $1,511/SF); treat single-year figures as individual data points.
127 total sales, 2020-2025. Median $6.55M. Median home: 6,309 SF, built 1996, 0.46-acre lot. 50 DOM, 96.1% L/S (2024-2025). The most liquid segment. In 2025, canal-front median reached $1,924/SF (n=18), exceeding the sole ICW sale.
58 total sales, 2020-2025. Median $3.25M. Median home: 3,332 SF, built 1993, 0.45-acre lot. 14 DOM, 94.7% L/S (2024-2025). 30 of 58 have golf course views. Price ceiling: $8.70M (a 5,205 SF home).
The $/SF premium overstates the pure water-position gap. Interior homes in this dataset are physically smaller (3,332 SF median vs. 6,309 SF for canal, 6,690 SF for ICW) and older (built 1993 vs. 1996 and 2002). Smaller homes typically carry higher $/SF because fixed costs (land, permitting) are spread over fewer square feet, and because kitchens and bathrooms represent a larger share of total area. ICW also has the highest post-2010 construction rate (38% vs. 33% canal, 26% interior). Some fraction of the 67% $/SF premium reflects age and size differences, not water alone. A buyer comparing across tiers should control for year built and living area, not just $/SF.
The canal-front segment is the backbone of the market: 127 of 201 waterfront sales (63%) are canal front, with sample sizes of 10 to 34 per year. ICW is a small-sample segment (n=33 total, as few as 1 sale per year). A single ICW transaction can move the annual median by $500+/SF. Canal-front data should carry more weight in any individual underwriting exercise.
190 of 201 waterfront homes have private docks. 160 carry "no fixed bridges" designations, meaning unrestricted ocean access. Dock capacity, vessel clearance, and bridge restrictions are not captured in MLS $/SF data but drive material pricing differences between otherwise comparable canal-front properties. A canal-front home with an 80-foot dock and a turning basin rated for a 60-foot yacht prices differently than one on a narrow cul-de-sac with a 30-foot slip, even at identical square footage.
The Widening Premium and Thinning Volume
In 2020, waterfront homes traded at $692/SF vs. $465/SF for interior, a 49% premium. On a trailing 24-month basis (2024-2025), waterfront trades at $1,863/SF vs. $1,113/SF: a 67% premium (n=49 WF, n=17 NWF). In 2025 alone, the gap widened to 105%, but this was driven by the denominator: interior $/SF fell from $1,166 to $908 (n=7, directional), while waterfront actually softened slightly from $1,932 to $1,862. The premium expanded because interior dropped faster, not because waterfront continued to rise.
Source: BeachesMLS via Spark API. Trailing 24-month (2024-2025): WF $1,863/SF (n=49) vs. NWF $1,113/SF (n=17) = +67%. 2025 premium driven by NWF decline, not WF gain. Per-year sample sizes: WF 54, 45, 18, 35, 23, 26. NWF 11, 9, 10, 10, 10, 7.
Three structural factors underpin the premium: waterfront lots are a fixed supply (122 unique addresses transacted, roughly 33 per year out of an estimated 400-500 waterfront homes), replacement cost for waterfront new construction has risen 30-40%, and no new waterfront land can be created. These are supply-side constraints, not demand cycles. The forward expectation is stability at current premium levels, not a further doubling.
Transaction volume tells a separate story. Total single-family sales have fallen from 65 (2020) to 54 (2021) to 28 (2022) to 33 (2024-2025). That is a 49% decline from the 2020 peak. Waterfront volume specifically dropped from 54 to 23-26 per year. This is not a rate-sensitivity effect: 93% of buyers are cash. Three explanations are plausible: owners are holding rather than selling at current prices (bullish for price support, bearish for selection); the community is aging and natural turnover is slowing; or buyer demand has plateaued after the post-COVID repricing. The answer matters for liquidity risk. A buyer entering at $12M should consider that the exit pool may be thinner than the entry pool.
Scenarios where the premium could compress: Florida insurance reform reducing the cost disparity between older and newer homes; a sustained drop in interest rates deepening the $2-5M buyer pool where interior homes compete; or a major capital assessment on aging community infrastructure. None is probable in the near term, but a buyer paying a 67% premium should know the conditions under which it could contract.
Where the Negotiation Room Is
The three tiers do not just differ in price. They differ in how aggressively sellers overprice and how much buyers negotiate off. This is one of the most actionable findings in the dataset, and it is not visible from active listing data alone.
Source: BeachesMLS via Spark API. ICW samples are small (n=10); directional. "Off Last List" is 100% minus close/last-list ratio. "Off Original Ask" is 100% minus close/original-list ratio.
ICW sellers are the most likely to overprice and the most likely to take significant haircuts. The median ICW sale in 2024-2025 closed at 86.3% of original ask, with individual sales closing as low as 61% and 73% of the original listing price. On a $15M original ask, 13.7% off translates to $2.1M in negotiation room at the median. Canal-front sellers price more accurately: 3.9% off last list, with 7 of 32 sales closing below 90% of original ask. Interior sellers are the tightest at 5.3% off, and their original ask matches their last list, meaning they rarely reduce before selling.
In 2024-2025, 17 of 49 waterfront buyers got 10% or more off the original asking price. On the median canal-front home ($12.23M), 10% is $1.2M. This is a negotiated market, not a scarcity auction. The supply constraint is real, but sellers routinely overshoot on initial pricing, creating material opportunity for prepared buyers. The ICW tier offers the most aggressive negotiation room; canal front offers the most reliable pricing; interior offers the least discount.
The Teardown Playbook
The headline appreciation in Admirals Cove waterfront (from $692/SF in 2020 to $1,863/SF trailing) conflates two different value-creation dynamics. The first is passive appreciation: hold the same structure and sell it later at a higher price. The second is teardown arbitrage: acquire an older waterfront home, demolish it, build new, and sell into a different price tier. The repeat-sale data makes the distinction clear.
25 waterfront addresses with 2+ transactions, 2020-2025. Hold period > 6 months.
The teardown playbook: 145 Commodore sold for $1.85M in 2020 (1988 build, 3,902 SF), then resold for $12.7M in 2025 (2022 rebuild, 5,306 SF). 127 Spinnaker: $4.33M (1990 build) to $20.93M (2025 rebuild). 104 Clipper: $4.5M to $15.75M in 2.1 years. These are gross returns before construction expenditure ($800-1,200/SF, or $4-7M on a typical 5,000-6,000 SF build). Net of construction, the 145 Commodore deal returns roughly 19% annualized on the total basis, which is still strong but a different number than the 53% gross. At the other end, hold-and-resell returns at the top of the market are more modest: 160 Spyglass returned 1% annualized on a $15.45M entry; 177 Commodore returned 6% on a $14M entry. Waterfront is not a guaranteed compounder once you strip out the teardown plays.
This distinction matters for underwriting. A buyer acquiring an older waterfront home at $4-6M with the intent to build new is running a development play with demonstrated gross returns. Net of construction cost (typically $4-7M), the annualized return on total capital deployed is in the high teens to low twenties, not 53%. A buyer acquiring a finished $12-15M waterfront home is making a lifestyle purchase with a more modest capital return profile. Both are legitimate strategies, but they carry different risk and different hold-period expectations. The article's headline appreciation figures (169% for waterfront since 2020) blend both dynamics. The hold-and-resell median of 18.7% annualized is the more relevant benchmark for a buyer who plans to live in what they purchase.
The $10M+ Market: 100% Waterfront
Fifty-six single-family sales have closed at $10M or above since 2020 in Admirals Cove. Every one was waterfront. The non-waterfront ceiling is $8.70M. The $8.70M sale was a 5,205 SF home; the same floor plan also traded at $8.40M in a separate transaction. A large, well-finished interior home can reach the mid-$8M range. It cannot reach eight figures. The ceiling is a function of buyer preference for water, not a lack of interior product at scale.
Canal front dominates the $10M+ bracket by volume (30 of 56 sales, 54%) because it has the deepest inventory. ICW dominates by per-sale pricing, with a 2024-2025 median of $13.45M (n=10). For a buyer targeting $10-15M, canal front offers substantially more selection. For a buyer willing to exceed $15M, ICW frontage is the only segment with consistent inventory. The cash rate in this bracket is 96% (54 of 56 sales): offers contingent on financing face a structural disadvantage.
In the condo market, the waterfront wall is even harder: 105 of 111 condo sales (95%) were waterfront. Only 6 non-waterfront condos traded in six years.
Total Cost of Ownership
Purchase price is the headline, but carrying costs determine the real gap over a hold period. The net math below models a 2024-2025 entry at trailing median pricing for each tier, using post-2010 construction with impact glass as the base case (which is where most buyers at this price point will land after renovating or building new).
For a pre-2000 waterfront home without storm upgrades, add $25-30K/yr to the insurance line ($60-80K/yr range), widening the annual carry gap accordingly.
The purchase price gap is $8.98M. The annual carrying cost gap is approximately $190K. Over a 10-year hold, cumulative carry adds roughly $1.9M, bringing the total cost differential to approximately $10.9M before any change in asset value.
On the appreciation side: since 2020, waterfront $/SF has risen from $692 to $1,863 (trailing), and interior from $465 to $1,113. However, the 2020-2025 period included a once-in-a-generation repricing (COVID relocation, SALT migration, institutional capital). Extrapolating that trajectory forward would be analytically irresponsible. What the data does support is a structural observation: waterfront lots are a fixed supply (roughly 7-8% annual turnover against ~400-500 waterfront homes), replacement cost is rising, and no new waterfront land can be created. The data is consistent with water position functioning as an appreciating asset component rather than a depreciating amenity cost, but the rate of future appreciation is not knowable from this dataset. A buyer should underwrite waterfront as a store of value supported by supply constraints, not as a growth investment benchmarked to 2020-2025 returns. For a buyer running the teardown playbook (Section 5), the return profile is different and demonstrably higher.
Membership equity and dues are identical for both paths: $375,000 golf equity plus $25,000 capital contribution at close, with annual dues of approximately $30,000. Insurance is the variable that diverges most sharply, and it diverges by construction era, not just by water position. Buyers evaluating waterfront should request a quote before making an offer, not after.
What to Look For in a Waterfront Property
Not all waterfront positions are equal, even within the same tier. The signals below separate properties that hold value from those that carry hidden cost.
One distinction the MLS does not capture: which canal sections carry the widest water and the best vessel maneuvering. Certain cul-de-sac canals are too narrow for larger yachts to turn, capping dock utility even if the slip is rated for a 50-foot boat. This requires walking the property and knowing the community at the lot level. If you are evaluating a canal-front home for boating use, confirm the turning basin width, not just the dock rating.
Buyer Diligence Checklist
Waterfront Buyer Diligence
Bottom Line
Lot position is the primary pricing variable in Admirals Cove, the trailing premium is +67%, and the gap is structural. But $/SF alone overstates the pure water premium because waterfront homes are larger, newer, and more heavily renovated. The most actionable findings are not the premium itself but what surrounds it: ICW sellers routinely close at 86% of original ask; 35% of waterfront buyers get 10%+ off; and the community's highest gross returns have come from teardown/rebuild plays (53% gross annualized, high teens net of construction) rather than passive holds (18.7% annualized). Transaction volume has halved since 2020 despite 93% cash participation, which warrants attention on exit liquidity. For a full view of how Admirals Cove compares to other gated communities, visit our Jupiter Gated Communities Guide.
For buyers targeting $10M+ canal front: You have the deepest selection (30 of 56 eight-figure sales) and the tightest pricing discipline (96.1% L/S). Start your offer at 90-92% of last list. Request original ask history; 7 of 32 canal sales closed below 90% of original. Focus diligence on seawall, dock capacity, insurance era, and association reserves.
For buyers evaluating ICW: ICW at $2,143/SF (n=10) carries a 14% premium over canal, but sellers are overpricing: median close is 86.3% of original ask. This is the tier with the most negotiation room, not the least. Target properties with extended DOM. Do not anchor to ask price; anchor to the canal-front comp set and add the ICW premium from there.
For buyers running the teardown playbook: Acquire a 1988-1995 waterfront structure at $4-6M, build new at $800-1,200/SF on 5,000-6,000 SF, sell into the $12-17M market. Eight repeat sales show 53% gross annualized returns; net of construction cost, expect high teens to low twenties on total capital deployed. The risk is construction cost overrun (15-25% in current South Florida) and a thinning resale market (33 annual sales, down from 65). Underwrite exit volume, not just entry pricing.
This analysis is based on 259 closed single-family sales and 111 closed condominium sales in Admirals Cove, Jupiter, FL, recorded in BeachesMLS via Spark API from January 2020 through March 2026. One non-waterfront single-family sale from January 2026 is included; all other sales closed between January 2020 and December 2025. Sales are classified as waterfront (Waterfront YN = Y) or non-waterfront based on MLS field data. Waterfront sub-segmentation (ICW, canal, other) uses MLS waterfront feature tags: "Intracoastal" for ICW frontage, "Canal Front" for canal properties. Properties carrying both tags are classified as ICW. "Other waterfront" includes navigable-water and lagoon positions without canal-front or ICW tags.
All $/SF figures are median closed price per living area square foot. Median is used rather than mean to reduce the effect of outliers. Trailing 24-month figures (2024-2025 combined) are the primary reference for buyer-relevant comparisons. Annual non-waterfront samples range from 7 to 11 sales (directional). ICW annual samples range from 1 to 12; single-year ICW figures represent individual data points. The 2025 premium of +105% is driven by a non-waterfront sample of n=7; the trailing 24-month figure of +67% (n=49 WF, n=17 NWF) is more defensible.
The $/SF premium across tiers conflates multiple variables: water position, home size, year built, and construction quality. Interior homes are physically smaller (median 3,332 SF vs. 6,309 SF canal, 6,690 SF ICW) and older (median year built 1993 vs. 1996 canal, 2002 ICW). A portion of the measured premium reflects these differences rather than water position alone. Controlling for size and age would require regression analysis beyond the scope of this report.
Repeat sales analysis identifies 66 addresses with 2+ transactions. Of these, 25 waterfront addresses with a hold period exceeding 6 months are included in the return analysis. Teardown/rebuild is identified by a change in year built or a greater-than-20% increase in living area between transactions. 8 sales met these criteria; the remaining 17 are classified as hold-and-resell. Annualized returns are calculated as CAGR. These are gross returns before transaction costs, carrying costs, and (for teardowns) construction expenditure.
Negotiation metrics: "Off Last List" is 100% minus (close price / last list price). "Off Original Ask" is 100% minus (close price / original list price). Both calculated from BeachesMLS fields. ICW negotiation depth (12.5% off last list, 13.7% off original ask) is based on n=10 and should be treated as directional.
Cash transaction rates are calculated from the "Buyer Financing" field. Cash rate: 93% for all waterfront SF, 96% for waterfront SF at $10M+, 91% for non-waterfront SF.
Insurance ranges are segmented by construction era: post-2010 with full impact glass ($35-50K/yr waterfront, $15-25K/yr interior) and pre-2000 without storm upgrades ($60-80K/yr waterfront, $25-40K/yr interior). These are directional ranges based on practitioner experience, not binding quotes.
Total cost of ownership uses a 1.8% effective property tax rate, construction-era-specific insurance, and publicly available HOA and membership fee data. The net math panels model post-2010 construction as the base case.
Absorption and turnover: 122 unique waterfront addresses transacted in 6 years, approximately 33-34 transactions per year. Against an estimated 400-500 waterfront homes, this is roughly 7-8% annual turnover.
Peer community $/SF comparisons are directional estimates from BeachesMLS closed data. Approximate and intended for positioning context, not precise underwriting.
Transaction Data: BeachesMLS via Spark API. 259 closed single-family sales and 111 closed condominium sales in Admirals Cove, Jupiter, FL, January 2020 through March 2026.
Community Data: Admirals Cove membership office, public filings, MLS association fee records. Membership equity ($375,000) and annual dues (~$30,000) approximate; subject to change by the club.
Insurance and Tax Estimates: Palm Beach County Property Appraiser, Florida Office of Insurance Regulation, practitioner experience with carrier quoting in the Jupiter waterfront submarket.
Peer Community Comparisons: BeachesMLS closed data for Bear's Club, Old Palm, Jupiter Island, Loxahatchee Club, Jonathan's Landing. Directional $/SF ranges only. Detailed comparison at palmbeachluxury.com/gated-communities/.
SB 4-D Reference: Florida Senate Bill 4-D (2022), milestone structural inspections for 25+ year condominium/cooperative buildings. Applicable to Admirals Cove condo structures; single-family homes affected by master association capital planning.