The Quarter
Every measure improved. Closings rose to 36, the per-foot median climbed 13 percent, and the median time to contract held inside three months at 88 days. The bigger change was the mix. The tower tier more than doubled its share of the quarter's sales. And the largest closing came from the corridor rather than the estate sections, for the first time in the recent record. The city's luxury market was built on its lakefront estates, and its growth now comes from its towers.
Source: BeachesMLS, closed residential sales at $3M+, West Palm Beach, Q2 2026
The Corridor's Quarter
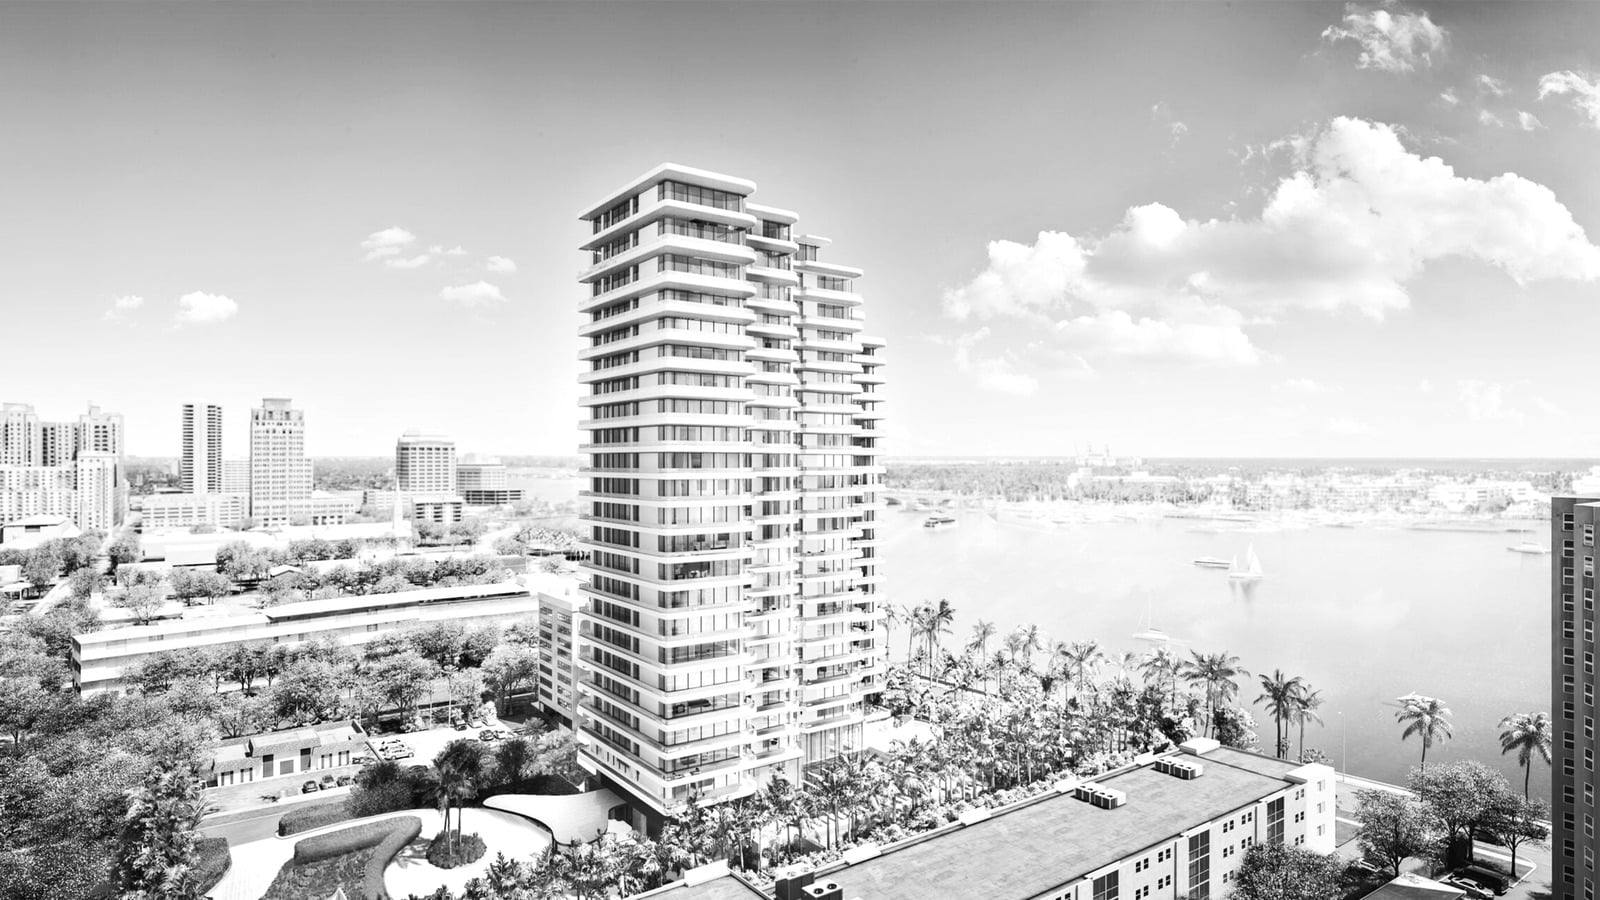
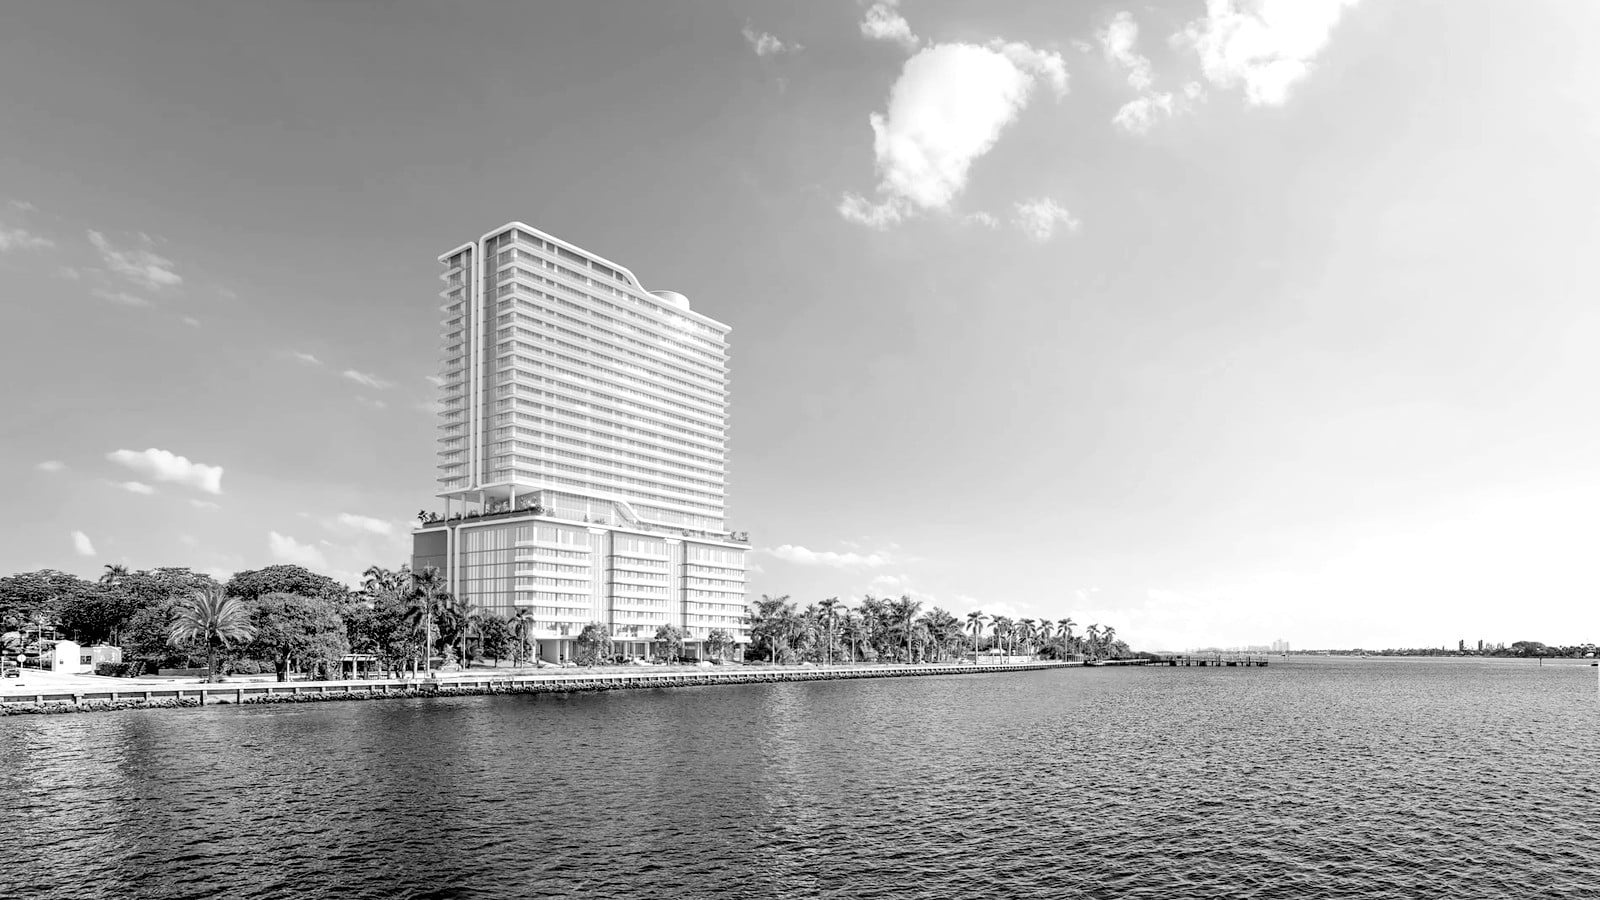
The Bristol's $19.4M sale topping the city extends a pattern this publication has documented all season across the corridor's buildings: the Bristol's price floor holding through every test, and the Plaza's position at the corridor's entry. Now the corridor has outsold the estates outright. Behind the headline, 1515 Flagler's $8M sale and the tower tier's $1,983 median per foot show the premium spreading across buildings rather than concentrating in one. The spread is the mark of a corridor maturing into an institutional market.
The construction pipeline reinforces the scarcity argument. The corridor's buildable waterfront sites are nearly exhausted, the next deliveries are already priced above the buildings standing today, and every completed building converts a construction site into a comparable. A tier whose supply is ending while its demand keeps growing tends to reprice upward between deliveries. The island of Palm Beach followed the same path after its own construction ended.
Towers and Estates
The estate half of the city still produced most of the sales and most of the dollars. The 27 house closings, led by an $18.2M waterfront sale and the lake-block streets of the historic districts, came in at a median $1,233 per foot. The per-foot gap is the clearest structural fact: the towers' $1,983 runs well above the houses, the inverse of most of the county. Corridor buildings compete with the island across the water while the city's houses compete with the mainland. The two tiers are effectively separate markets, the overall median will keep swinging with whichever tier finds inventory, and this report keeps them separate for that reason.
Five Years of West Palm
The five-year record shows steady growth with a change of driver. Closings climbed from 60 in 2021 to 88 in 2025, and the per-foot median rose from $1,099 toward the current quarter's $1,343. The source of the growth shifted along the way: the early years were estate repricing, the recent ones are tower deliveries and corridor scarcity. The financial district still draws wealth to the city, and the corridor's buildable sites are nearly gone. The luxury market here is becoming a scarcity market, as the island's did before it, one delivery cycle at a time.
Source: BeachesMLS, closed residential sales at $3M+, West Palm Beach, full years
Source: BeachesMLS, closed residential sales at $3M+, West Palm Beach
Bottom Line
West Palm Beach had its biggest recorded second quarter: a 13 percent per-foot gain, the tower tier doubling its share, and the quarter's largest sale coming from the Bristol rather than an estate. The financial district keeps bringing buyers, and the corridor's limited supply now sets the city's prices.
For buyers weighing the city: Treat the towers and the estates as separate markets. The corridor prices against the island, the houses price against the mainland, and the spread between $1,983 and $1,233 per foot reflects that structure rather than an anomaly.
This report covers every residential closing at $3,000,000 or above recorded in West Palm Beach from April 1 through June 30, 2026 (36 sales). It compares against the same quarter of 2025 (30 sales), with five-year context from January 2021. All figures run through June 30, 2026. Cross-listed duplicates are removed by address, close date, and price. Medians are used throughout and reported per product where the products diverge. Days on market measure list date to contract date. Community names are normalized from raw MLS subdivision records.
All data sourced from BeachesMLS via the Spark API.