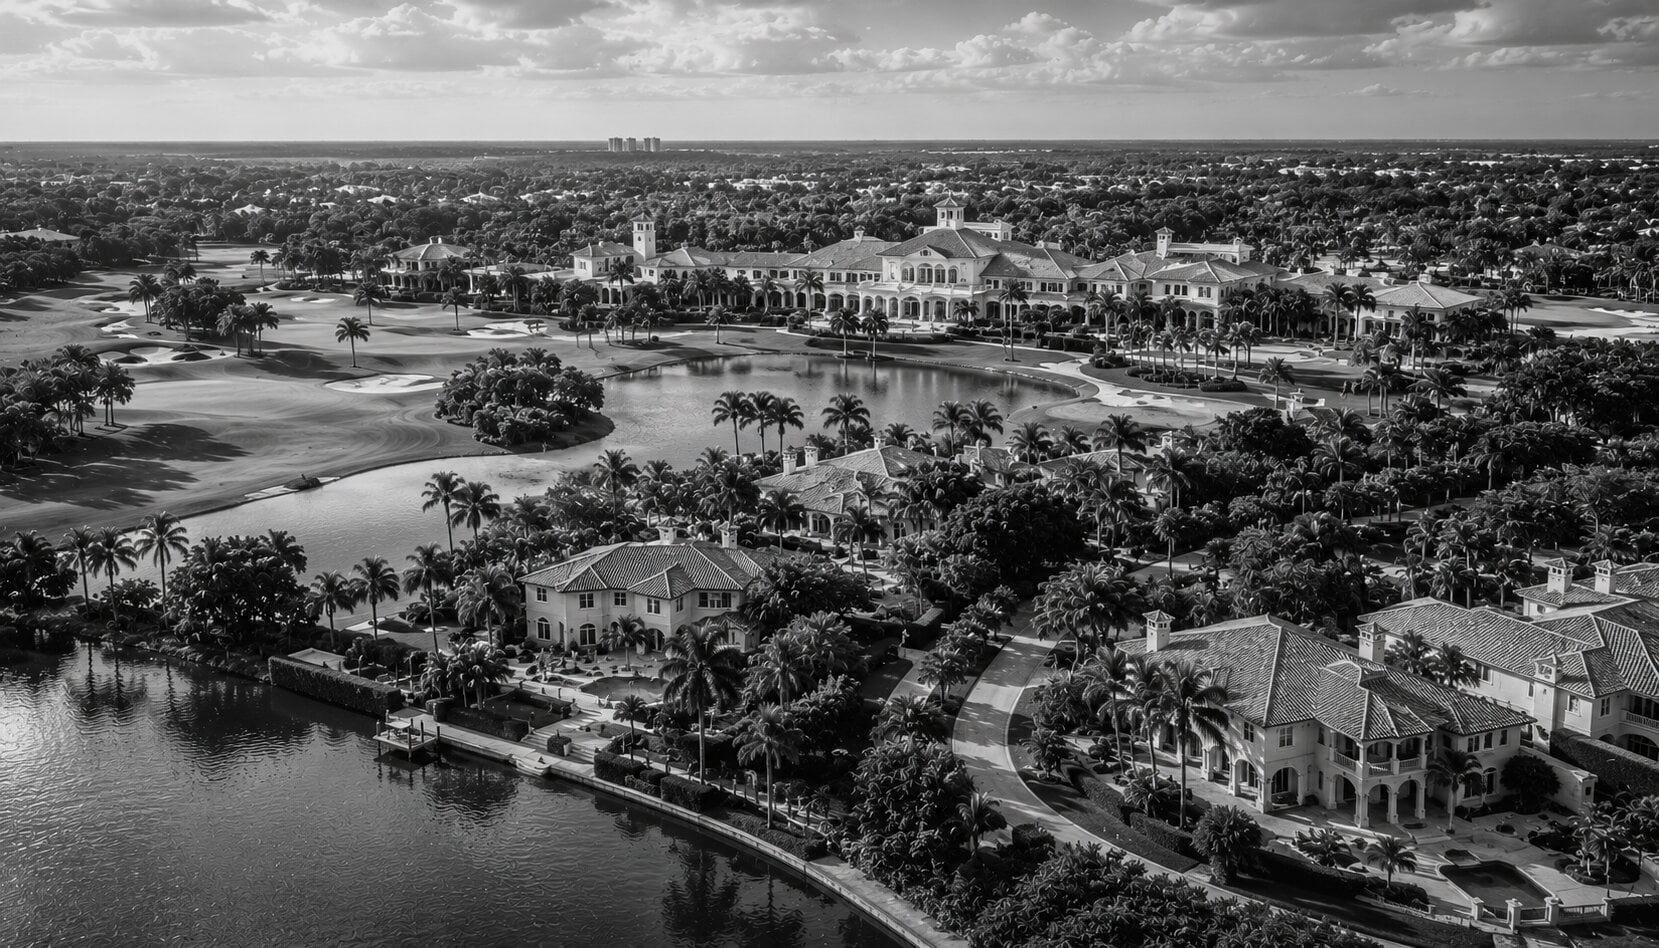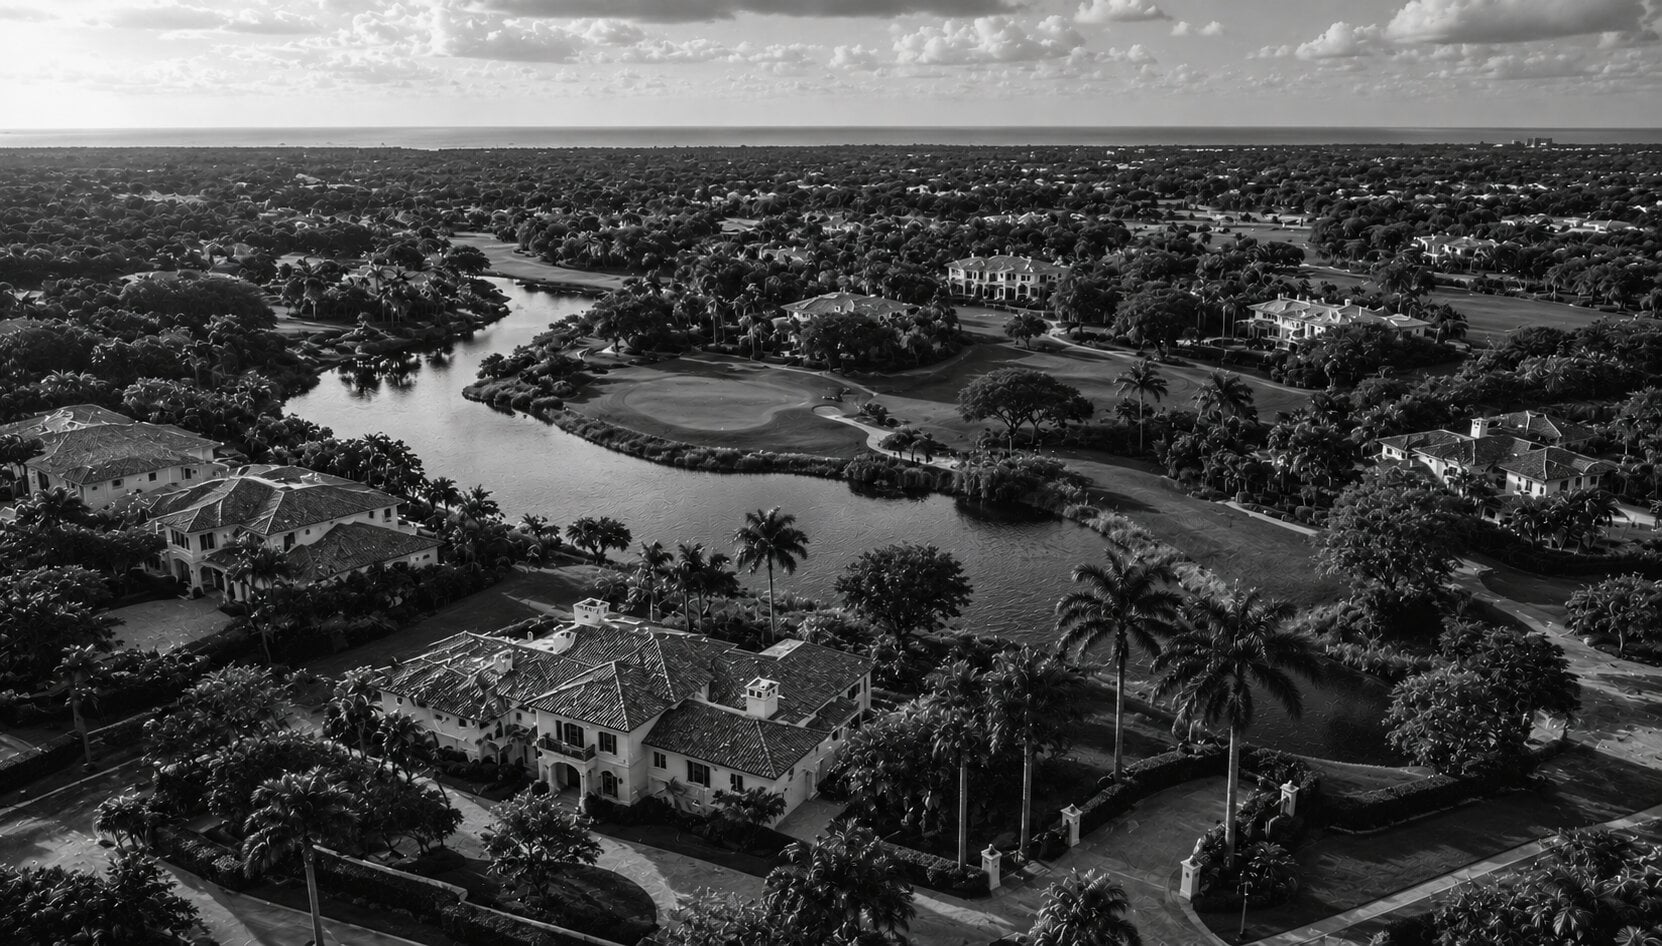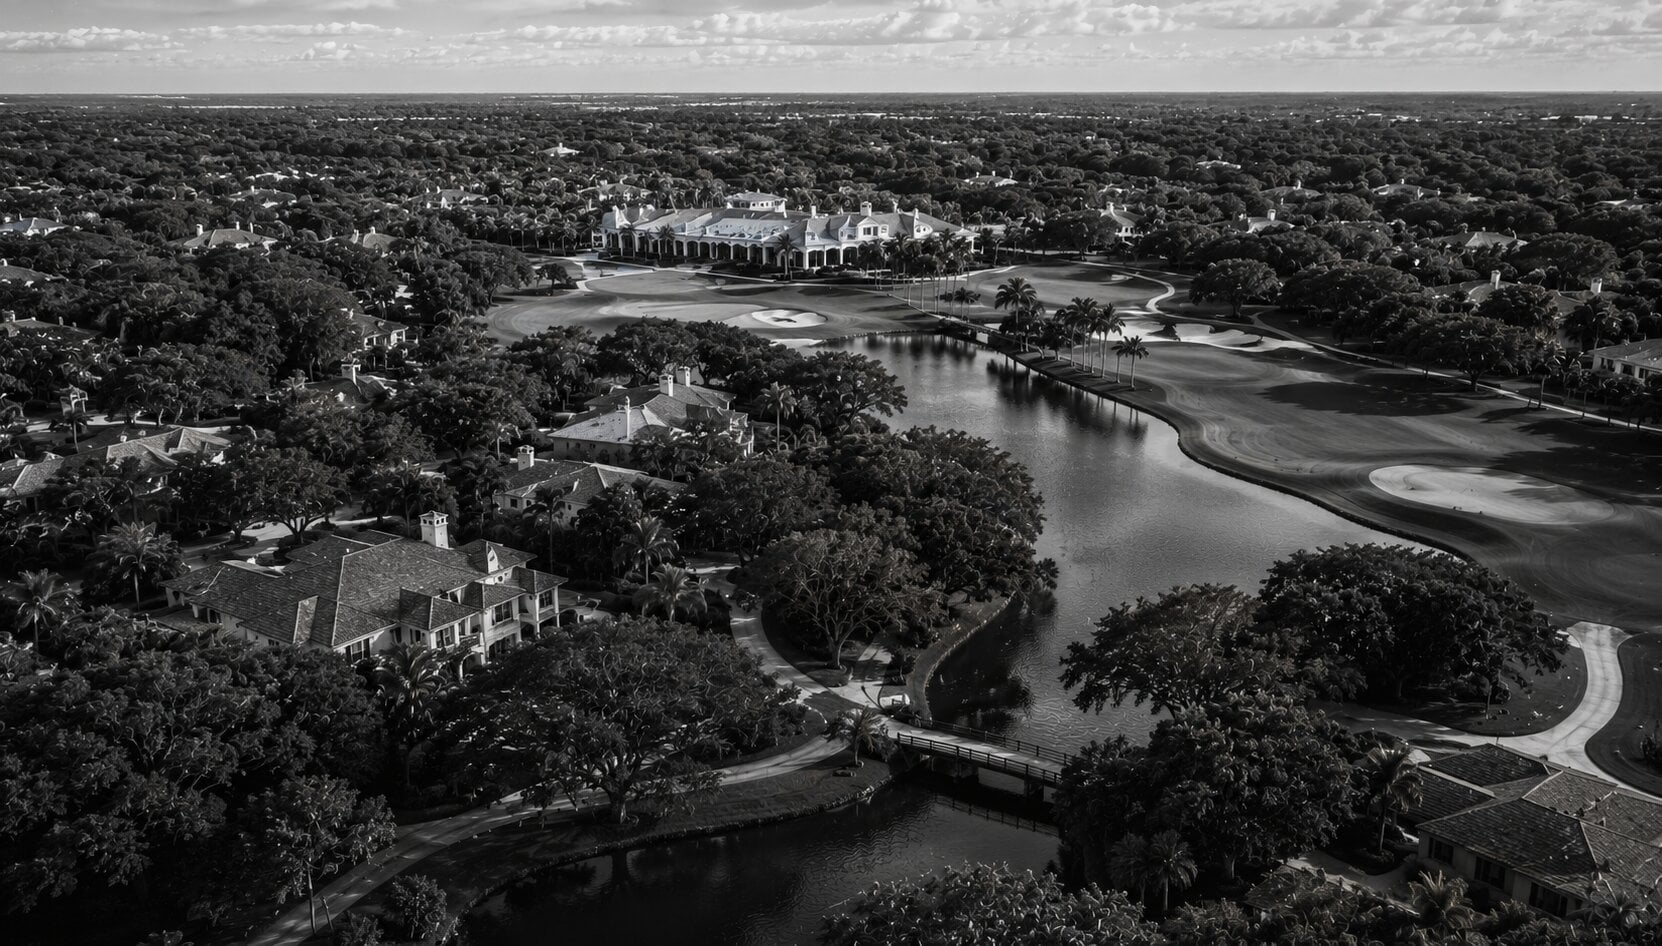
The analysis covers 64 closed residential sales at The Loxahatchee Club from January 2020 through March 2026, sourced from BeachesMLS via Spark API. For each sale, we track closing price, price per square foot, days on market, list-to-sold ratio, cash vs. financed, lot size, living area, and year built. Sales are segmented by year, price tier, and build era. Corridor comparisons use the same dataset for Lost Tree Village and Bears Club.
The $/SF Trajectory: $305 to $872 and What Drove It
The headline number is 186% appreciation in median price per square foot from 2020 to the 2024-2025 period. That figure is real, but it requires context. The 2020 base of $305/SF was set by eleven sales that included multiple sub-$600K legacy homes trading at $210 to $280 per square foot. Those properties would not transact at anything close to those levels today. Some of the measured appreciation reflects genuine price growth on comparable homes. Some reflects a compositional shift: low-value legacy inventory left the comp set, pulling the median upward mechanically.
This is not a same-property repeat-sale index. Individual owner returns vary depending on purchase year, condition at acquisition, and renovation spend. The direction of the re-rating is real: Loxahatchee was underpriced relative to its course quality and community through 2020. The magnitude, measured against a depressed base, overstates what any single buyer or seller experienced.
Source: BeachesMLS via Spark API. 2024-2025 highlighted. The 2024 dip to $748 reflects a compositional shift (more lower-priced sales in the mix), not a market correction. 2026 is partial year (2 sales).
The median $/SF dropped from $811 in 2023 to $748 in 2024 before rebounding to $1,002 in 2025. This was not a price correction. In 2024, the mix included a $0.95M sale at $297/SF (a pre-1990 home on 4,104 SF) and a $1.45M sale at $543/SF. These pulled the 2024 median down while higher-priced sales in the same year ($8.55M at $1,346/SF, $3.20M at $1,146/SF) showed continued strength at the top. When the 2025 cohort excluded legacy-priced inventory, the median snapped back. In a community with 8 to 9 annual sales, two low-priced transactions can move the median by 10% to 15%.
Sales Volume by Year: The Post-Pandemic Arc
The volume story at Loxahatchee follows the broader Jupiter corridor pattern with one notable exception: the 2022 compression was sharper here than at larger communities. In 2021, Loxahatchee traded 17 homes, roughly 6% of the community, the highest turnover in the dataset. By 2022, volume dropped to 8 sales, but those 8 sales closed at a median DOM of 6 days. Homes were going under contract almost on arrival.
Since 2022, the annual pace has stabilized at 8 to 9 sales. This is not a distressed market. It is a 285-home community where most owners are long-term holders, and the handful of listings each year attract a focused buyer pool that moves in cash. The 2026 pace (2 sales through March) projects to roughly 8 for the full year if the seasonal pattern holds.
Build Era and Renovation Economics
61% of all transacted homes at Loxahatchee were built before 2000. Pre-1990 stock (21 of 64 sales) carries a $502/SF median. 2020+ construction (4 sales) carries $1,034/SF. That $532/SF gap on a 4,800 SF home (the community median) represents roughly $2.55M in price difference. A comprehensive renovation of a pre-1990 home runs $150 to $300/SF depending on scope, placing the all-in cost of a renovated older home at $650 to $800/SF. That still undercuts new construction pricing by 20% to 35%.
For the market report reader, the build era story is a pricing floor question. As older homes get renovated and re-enter the comp set at higher $/SF, the community median rises. The sub-$1M segment (17% of all sales, nearly all pre-1990) is effectively gone at current pricing. The $1M to $2M segment is thinning. Each legacy home that sells, renovates, and re-lists at $800/SF instead of $400/SF ratchets the floor higher. This is the structural mechanism behind the appreciation: not speculative buying, but a housing stock gradually upgrading itself.
Renovation inside the gates. Loxahatchee requires architectural review board approval for exterior modifications. Construction access, hours, and contractor credentials are regulated by the community. Factor three to six months of design and approval lead time before construction begins. This is not a constraint unique to Loxahatchee; it is standard across private Jupiter communities. But it adds timeline and cost that buyers should budget for beyond the per-foot renovation estimate.
Negotiating Dynamics: L/S, DOM, and Cash Rate
Three metrics define how a Loxahatchee transaction actually negotiates: list-to-sold ratio, days on market, and financing type. Each has moved significantly since 2020, and the current levels tell buyers and sellers exactly what to expect.
Based on 2024-2025 closed transactions (17 sales)
The L/S range across 2024-2025 is wide: 86.7% in 2024 versus 92.2% in 2025. The 2024 figure is the lowest annual L/S in the entire dataset, lower even than 2020 (92.4%). This was partly compositional: the $0.95M sale at $297/SF and the $8.55M sale at 79.6% L/S both pulled the annual median down. But the signal is worth watching. If 2024 represents the beginning of a buyer-power shift at higher entry points (where new buyers negotiate harder because the community's value proposition is no longer obvious), the L/S framework may be resetting to a lower band. The 2025 recovery to 92.2% suggests the 2024 dip was transactional rather than structural, but one year of recovery is not a trend. Sellers should price to the 90% to 93% L/S range and treat anything above that as upside.
The cash rate trajectory is the clearest signal of buyer composition. In 2020, 82% of sales were cash. By 2024 and 2025, that figure reached 100%. Every recent buyer closed without a financing contingency. For sellers, this means appraisals are largely irrelevant to pricing. For buyers who plan to finance, the competitive reality is that your offer stands against all-cash bids with no appraisal or lending contingency. Compensate with speed and certainty: pre-approval, minimal contingencies, 30-day close or better.
DOM has normalized from the 2022 spike (6-day median) to a 55-74 day range in 2024-2025. This gives buyers a two-to-three month decision window, which is healthy for diligence, especially when renovation planning is part of the purchase thesis. Sellers who price within the 93% L/S framework close within that window. Those who price aspirationally sit.
Corridor Comparison: Loxahatchee Against Density Peers
The frequently cited comparison is Loxahatchee at $872/SF versus Bears Club at $1,484/SF. That framing overstates the value gap because it ignores a four-fold difference in lot size. Bears Club estates sit on 1.19-acre median lots; Loxahatchee on 0.30 acres. You are comparing different product classes. The honest density peer in the corridor is Lost Tree Village, where recent overall pricing runs $1,673/SF on 0.45-acre median lots. Loxahatchee trades at roughly half that level.
Source: BeachesMLS via Spark API, 2020 through Mar 2026. Bears Club = estate segment (24 sales). Lost Tree = single-family for all-time $/SF (52 sales); recent $/SF is overall (70 sales, SF + condos) because SF-only recent is not cleanly segmented. Lost Tree condos trade at higher $/SF than SF homes, so the blended $1,673 may slightly overstate the SF-only recent figure. L/S and Cash Rate are all-time medians. Appreciation = $/SF change from 2020 base to 2024-25.
Three patterns emerge from the comparison. First, Loxahatchee has the tightest L/S ratio (93.2%) of the three, suggesting the most efficient price discovery. Bears Club at 89.1% reflects aspirational pricing in a market where buyers negotiate harder given thin comps. Second, the appreciation gap is striking: Loxahatchee at +186% versus Lost Tree at +53% and Bears Club at +97%. All three appreciated, but Loxahatchee started from a lower base and re-rated faster. Third, the $/SF gap to Lost Tree has actually widened in recent years: Lost Tree moved from $1,097/SF (2020) to $1,673/SF (2024-25), meaning both communities appreciated but Lost Tree's higher base grew in absolute dollar terms.
The density-adjusted comparison requires a caveat. Lost Tree's recent $1,673/SF includes condo sales, which trade at higher per-foot levels than its single-family homes ($1,459/SF all-time for condos vs. $1,320/SF for SF). The true SF-to-SF gap is narrower than the 48% headline figure suggests, likely in the 35% to 45% range. On every available basis, Loxahatchee trades at a substantial per-foot discount to its closest density peer, roughly half the cost for a community with the same Nicklaus pedigree. Whether that gap narrows depends on the pace at which Loxahatchee's older inventory gets renovated and repriced.
Is There Room Left to Run?
The data supports arguments on both sides. Here is the case for each, drawn from the transaction evidence rather than sentiment.
The most likely path is neither a continued surge nor a correction, but a gradual convergence toward corridor peers. Loxahatchee's current $872/SF sits roughly 48% below Lost Tree's recent overall pricing ($1,673/SF). If the community converges even a third of the way (accounting for the fact that Lost Tree is also appreciating), that implies approximately $1,140/SF on the median home, roughly $5.5M. That represents a 31% increase from recent pricing. Based on the renovation cycle required to upgrade the pre-2000 housing stock, the timeline for this kind of convergence is more likely 5 to 8 years than 2 to 3; annualized, that translates to roughly 3.5% to 5.5% per year in $/SF growth, which is above inflation but well within historical norms for re-rating private communities. For sellers, the data supports listing into this trajectory rather than waiting for an additional surge. For buyers, the value proposition is real but no longer cheap; you are buying into a re-rated community, not catching it before the re-rating starts.
Bottom Line
Loxahatchee has completed a structural re-rating from an undervalued base. The easy gains are behind it. What remains is a per-foot cost roughly half that of Lost Tree Village (its closest density peer), a housing stock that is mid-renovation cycle, and a buyer pool that operates entirely in cash. The question is no longer "is this community underpriced?" but "how quickly does the remaining gap to peers close, and at what annualized rate?" The data supports continued but more moderate appreciation in the 3.5% to 5.5% annual range, driven by renovation activity rather than speculative demand. For both buyers and sellers, the actionable insight is timing: this is a market where the right property at the right price still exists, but the window of significant discount to corridor peers is narrowing as each legacy home upgrades and reprices.
For sellers: List into the current trajectory. The 2024-2025 L/S range of 87% to 92% gives you a realistic pricing window; target the 90% to 93% band and treat anything above that as upside. A home priced within the framework closes in 55 to 74 days to a cash buyer. Overpricing by more than 8% to 10% pushes you past the 90-day mark where buyer interest resets. The data does not support waiting for a further spike; it supports capturing the re-rated pricing now.
For buyers at $2M to $4M: You are in the core of the market where the most inventory exists. Renovation economics favor this tier: acquire at $600 to $800/SF, renovate at $150 to $300/SF, and end up at $750 to $1,100/SF all-in. Every comparable buyer is paying cash. If you need financing, compensate with speed, certainty, and a clean contract.
For buyers evaluating Loxahatchee against corridor peers: Compare density to density. Loxahatchee at $872/SF trades at roughly half the per-foot cost of Lost Tree Village's recent overall pricing ($1,673/SF on 0.45-acre lots). The precise SF-to-SF discount is narrower (Lost Tree's blended figure includes higher-$/SF condos), likely 35% to 45%. Bears Club at $1,484/SF is a different product class entirely (1.19-acre lots, 13,300 SF homes). If you are choosing between Loxahatchee and Lost Tree, the question is whether the walking course, the 285-home intimacy, and the $3M+ price gap justify the smaller lots and older stock. That is a conversation worth having with someone who knows both communities from the inside.
Data covers 64 closed residential sales at The Loxahatchee Club (Jupiter, FL) from January 2020 through March 2026, sourced from BeachesMLS via Spark API. Sales include 63 single-family homes and 1 condo/villa transaction. Metrics tracked per transaction: sale price, original list price, final list price, days on market (cumulative), living area (square feet), lot size (acres), bedrooms, year built, and financing type (cash vs. conventional/other).
Median values are used throughout unless otherwise noted. In a dataset of 64 sales, medians are more resistant to outlier distortion than means. The $11.25M transaction (April 2025) significantly affects the mean ($2.63M) relative to the median ($2.17M). Price per square foot is calculated as sale price divided by living area per MLS records.
The 186% appreciation figure ($305/SF in 2020 to $872/SF on 2024-2025 sales) is a median-to-median comparison, not a same-property repeat-sale index. The 2020 base included several sub-$600K legacy sales at $210 to $280/SF. Some measured appreciation reflects genuine price growth; some reflects a compositional shift as low-value inventory left the comp set. Individual owner returns vary by purchase year, condition at acquisition, and renovation spend.
Build era categories use the year-built field from MLS data. Renovations are not captured in this field; a home listed as "built 1988" may have been substantially renovated since. Buyers should verify renovation history independently.
Renovation cost estimates ($150 to $300 per square foot for comprehensive renovation of pre-1990 homes) reflect practitioner observation from transaction advisory work in the Jupiter corridor and are not sourced from a formal construction cost database. Actual costs vary by scope, permitting, contractor, and material specification. These are directional and should not be used for budgeting without independent contractor bids.
Corridor comparisons use the same BeachesMLS/Spark API dataset across the same 2020-2026 period. Lost Tree Village all-time SF median ($1,320/SF, 52 transactions, 0.45-acre median lot) is the primary density peer for structural comparison. Lost Tree's recent overall $/SF ($1,673/SF, 2024-2025, 70 transactions including condos) is used for the pricing gap analysis. Lost Tree condos trade at higher $/SF than SF homes ($1,459/SF vs. $1,320/SF all-time), so the blended recent figure slightly overstates the SF-only recent level. Bears Club estate metrics (24 transactions, 1.19-acre median lot, $1,484/SF recent, $12.32M median) are cited for Nicklaus corridor context but represent a structurally different product class due to the four-fold difference in lot size.
The convergence estimate in Section 6 (~$1,140/SF, ~$5.5M) is a mechanical illustration assuming one-third closure of the gap between Loxahatchee's recent $872/SF and Lost Tree's recent overall $1,673/SF, over a 5 to 8 year period. It is not a forecast. The one-third assumption accounts for the fact that Lost Tree is also appreciating (the target is moving). The 3.5% to 5.5% annualized range is derived from this mechanical illustration and should not be treated as an expected return. Actual pricing depends on renovation pace, macro conditions, inventory composition, and buyer demand.
Transaction Data: BeachesMLS (Beaches Multiple Listing Service) via Spark API. Closed residential sales at The Loxahatchee Club, Jupiter, FL. January 2020 through March 2026. 64 transactions.
Corridor Comparisons: BeachesMLS via Spark API. Lost Tree Village single-family sales (52 transactions, 2020-2026). Bears Club estate sales (24 transactions, 2020-2026). Same dataset, same period, same methodology.
Club Recognition: Forbes / Platinum Clubs of the World, Top 20 ranking, 2025-2026 cycle.
Property Tax Data: Palm Beach County Property Appraiser (pbcpao.gov). Tax figures as recorded in MLS at time of sale.