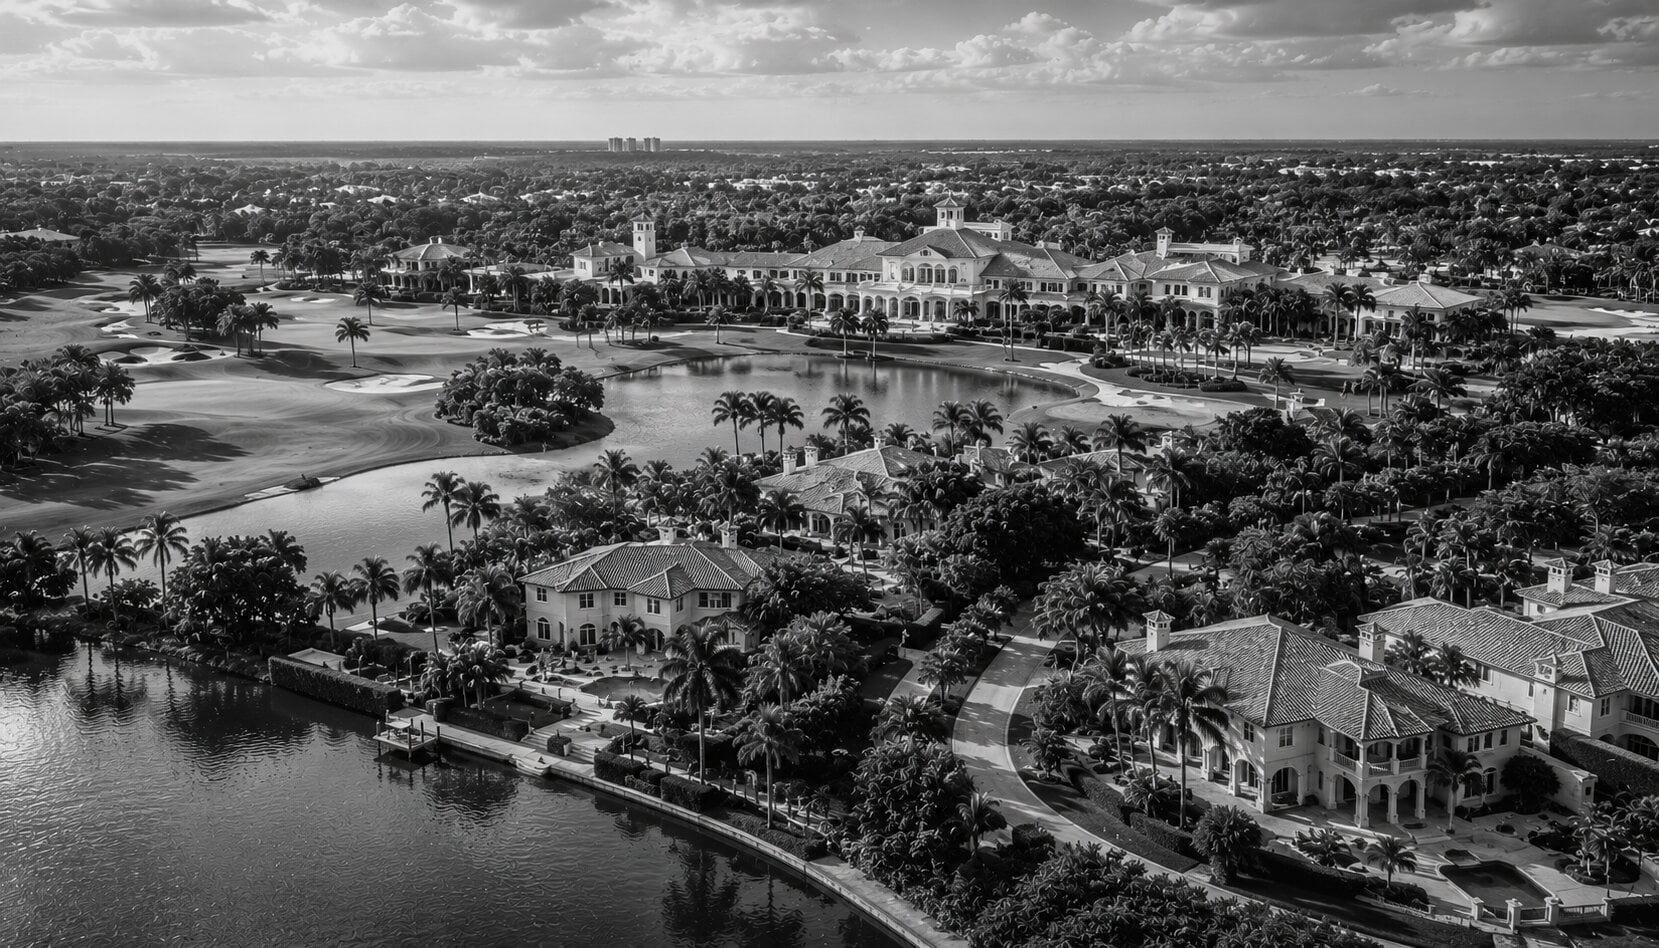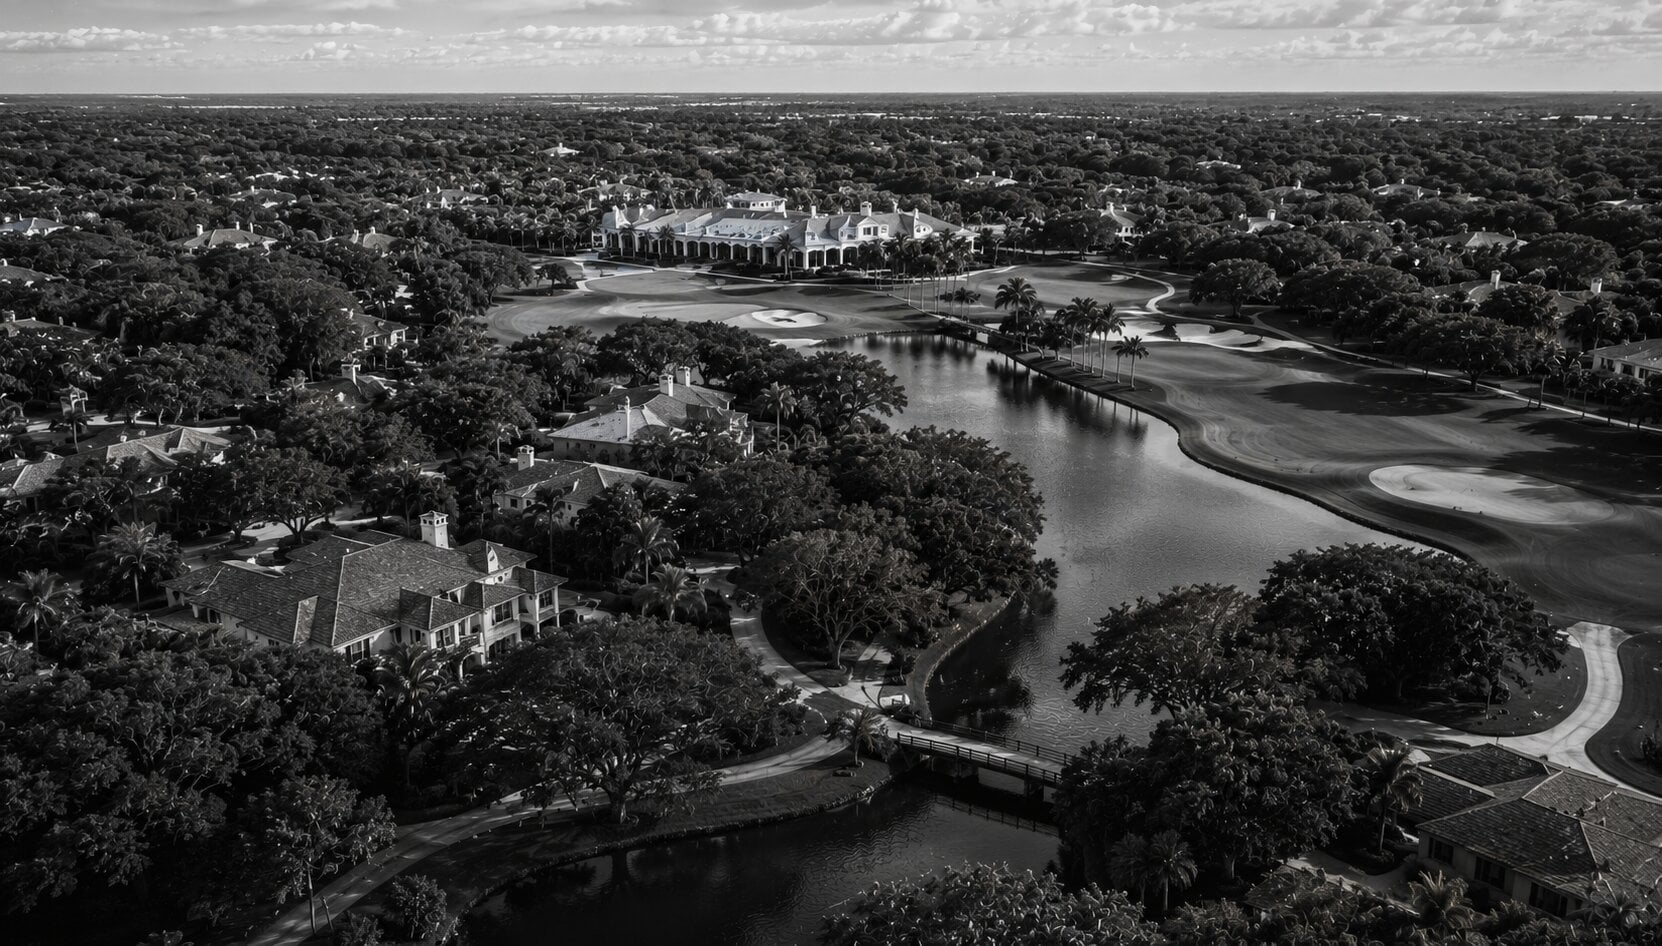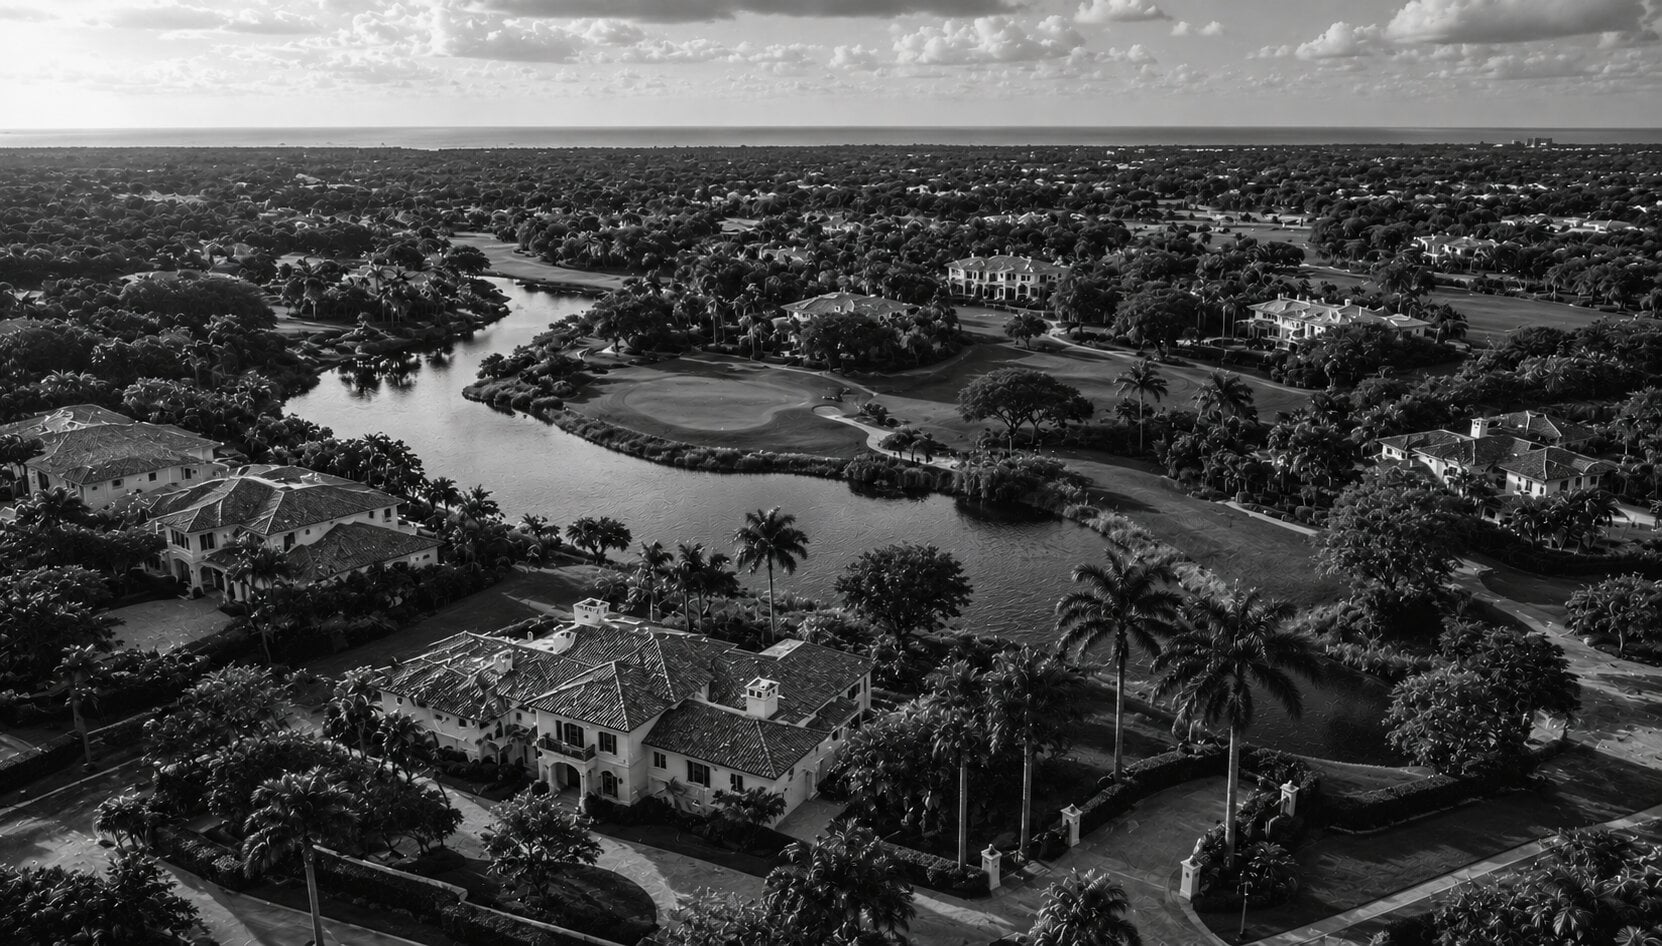
The analysis draws from 56 closed residential transactions in Old Marsh Golf Club, sourced from BeachesMLS via Spark API, spanning January 2020 through March 2026. For each sale, we track closing price, price per square foot, days on market, list-to-sold ratio, financing method, home size, lot acreage, build year, and property type. All 56 transactions are single-family estates in a community of approximately 60 homes on 456 Audubon-certified acres.
The Appreciation Trajectory: $395/SF to $1,037/SF
Old Marsh's median price per square foot has moved from $395 in 2020 to $1,037 across the 2024 to 2025 period, a gain of 163%. This is the second-highest appreciation rate in the corridor, behind only Loxahatchee Club (+186%). Early 2026 (one closing at $6.55M and $1,148/SF) suggests the trajectory is continuing, though a single-sale data point carries limited statistical weight.
The appreciation story at Old Marsh is partly a correction. The 2020 starting point of $395/SF was low relative to the product quality: a Pete Dye course on 456 Audubon-certified acres with half-acre lots should not have traded below $400/SF, and the market has since adjusted. The repricing accelerated in 2022 when $/SF reached $794, and the community has held near or above that level since, with every subsequent year exceeding $800/SF. The 2024 figure of $1,105/SF on only 4 sales represents the high-water mark for a full-year cohort, though the small sample makes it directional rather than definitive.
Old Marsh Golf Club, 56 closed sales, January 2020 through March 2026
For corridor context: Loxahatchee Club appreciated +186% over the same period from a similarly low 2020 base. Loxahatchee has roughly 285 homes (compared to Old Marsh's 60), suggesting that the appreciation was driven by product-quality repricing across the corridor, not solely by Old Marsh's smaller lot count. Old Palm appreciated +110% from a higher starting point of $524/SF.
Source: BeachesMLS via Spark API. Bar height = median $/SF. Label above = closed sales.
Sales Velocity and What Near-Total Turnover Reveals
Fifty-six sales in a community of approximately 60 homes means that nearly every estate has changed hands since 2020. At the current pace of 9 sales per year, the implied absorption rate depends on available inventory: with active listings typically numbering one to three homes at any given time, Old Marsh operates at roughly one to three months of supply. By institutional standards, that is a tight seller's market (under three months favors sellers; over six months favors buyers).
The yearly pattern: 12 sales each in 2020 and 2021, 9 in 2022, 8 in 2023, 4 in 2024, and 10 in 2025. The 2024 dip to 4 sales is more likely an inventory constraint than a demand problem: DOM was 56 days (still fast for the corridor) and L/S was 97.4% (the tightest in the dataset alongside 2022). When homes listed, they sold quickly and at near-ask; there simply were not many homes to sell. The 2025 rebound to 10 sales, the most active year since 2021, with 100% cash transactions and $987/SF pricing, confirms that demand was waiting for supply.
Source: BeachesMLS via Spark API. Median values per calendar year. DOM = days on market. L/S = list-to-sold ratio.
The 15% annual turnover is not distress; it is generational transition. In a 60-home community, 9 annual sales represent a remarkably high percentage of total inventory. The data rules out distress: +163% appreciation and 95.2% L/S are not the signatures of a community people are leaving. Based on practitioner observation, the turnover reflects original owners from the 1990s and early 2000s selling to a newer cohort drawn to the Pete Dye course and the Audubon setting. The community is not losing residents; it is replacing them with buyers who are renovating and reinvesting.
Why Old Marsh Sells Faster Than Any Other Club
Old Marsh's historical median DOM of 34 days is the fastest in the corridor: Admirals Cove (44 days), Loxahatchee (56 days), Old Palm (76 days), Lost Tree (92 days), Bears Club (103 days). In the current market, DOM has lengthened: 62 days in 2025 and 56 days in 2024. But 2023 was 16 days, the lowest single-year figure in the entire dataset for any community. The variability is a function of sample size: in a community with 4 to 12 annual sales, a single estate at $7M with 194 days on market (as occurred in 2025) can shift the yearly median by 20 to 30 days.
The structural explanation for the speed is supply constraint. With only 60 homes and one to three active listings at any point, buyers who are waiting for Old Marsh inventory recognize when the right home appears and move decisively. This is a different dynamic than Admirals Cove (900+ residences, deeper inventory, more selection time) or Old Palm (300 lots, broader price range). At Old Marsh, the buying decision is binary: this is the home, or you wait for the next one, which may not list for months.
The cash rate at Old Marsh is 82% across all 56 sales. In 2025, it reached 100%: every transaction closed without financing. In 2020, the rate was 92%. The only year with a meaningfully lower cash rate was 2022 at 56%, where 4 of 9 sales involved financing. For a family office or high-net-worth buyer evaluating long-term hold risk, Old Marsh's cash dominance provides a structural buffer against interest rate movements. Rate-driven repricing, which has affected financed segments across South Florida, has limited transmission into a market where most transactions do not involve a mortgage.
Build Era Breakdown and the Renovation Premium
Old Marsh's housing stock spans four decades. Five of the 56 sales involved pre-1990 construction, 17 involved 1990s builds, 19 involved 2000s builds, 10 involved 2010-2019 product, and 5 involved 2020 or later construction. The pre-2010 stock represents 73% of all transactions.
The pricing gap between eras is substantial. The 2010-2019 cohort carries an all-time cohort median of $987/SF, compared to $580/SF for 1990s builds and $588/SF for 2000s builds. The 2020+ cohort (5 sales) trades at $1,092/SF. An anomaly worth noting: the pre-1990 cohort (5 sales) shows $827/SF, which is higher than both the 1990s and 2000s cohorts. This is not because older homes are more valuable per se; it reflects two small-footprint 1988-built homes (approximately 2,400 SF each) where the smaller denominator inflates the per-square-foot figure. The absolute prices in the pre-1990 cohort ($1.43M to $1.50M) are among the lowest in the dataset.
Source: BeachesMLS via Spark API. Cohort $/SF is the all-time median for each build era across all sale years, not a current pricing benchmark. Pre-1990 $/SF elevated by small-footprint homes (~2,400 SF) where the smaller denominator inflates the ratio.
The renovation premium is the clearest signal in the data. The 2010-2019 cohort trades at a 68% to 70% all-time premium over the 1990s and 2000s cohorts on a per-square-foot basis. In the current market, a renovated 1990s-era home competes for pricing closer to the 2010s cohort, while an unrenovated original-condition estate prices to the lower end of its era. For sellers considering a renovation before listing, the data supports the investment: the per-square-foot gain from moving out of the "original condition" category into the "renovated" category is the single most impactful pricing lever available in this community.
Old Marsh vs. Old Palm: The Scarcity Question
Old Marsh at $1,037/SF (2024-25) versus Old Palm at $1,101/SF (2024-25) is a 6% gap. For two communities with fundamentally different scarcity profiles (60 homes versus 300), this is a narrow spread. In most luxury real estate markets, a community with one-fifth the lot count and comparable product quality would command a meaningful premium. At Old Marsh, that scarcity premium has not fully materialized in the $/SF data.
There are structural reasons the gap persists. Old Marsh's smaller size means less market visibility: fewer listings, less search traffic, less agent awareness. Old Palm, with 27 annual sales versus Old Marsh's 9, generates more comparable data, more listing activity, and more price discovery. Buyers searching for "PBG golf club homes" are more likely to encounter Old Palm first. Old Marsh's housing stock also skews older (73% pre-2010 versus Old Palm's roughly 48% in the 2000-2009 cohort alone), which moderates the $/SF when condition is not controlled for.
14 sales in 2024-25. Pete Dye course, 456 Audubon acres, 0.51-acre median lots, 6,291 SF median home. 15% annual turnover. The scarcity is structural (60 homes) but the $/SF has not fully priced it in. Older housing stock (73% pre-2010) moderates the figure.
35 sales in 2024-25. Raymond Floyd course, 0.46-acre median lots, 7,352 SF median home. 9% annual turnover. More price discovery, more comparable data, more market visibility. The higher $/SF partly reflects newer housing stock (51% from 2010-2019).
For the buyer, the question is whether this gap represents a buying opportunity or a structural feature. If Old Marsh's limited visibility is the primary driver of the pricing gap, then the community is undervalued and the $/SF has room to converge with Old Palm or exceed it as market awareness grows. If the older housing stock is the driver, then the gap will close only as renovation activity updates the inventory. The data is consistent with both explanations, and the answer is likely a combination of the two. Either way, a buyer at $1,037/SF in a 60-home community is paying nearly the same rate as a buyer at $1,101/SF in a 300-home community, which frames Old Marsh as the relative value play within the PBG corridor.
Pricing Efficiency and the L/S Signal
Old Marsh's all-time list-to-sold ratio of 95.2% is the second-tightest in the corridor, behind Mirasol (96.0%) and ahead of Admirals Cove (95.5%), Old Palm (94.4%), and Bears Club (89.1%). In 2024, the ratio reached 97.4%. In 2025, it was 94.8%. The practical read: sellers who price within 5% of where the market will close are selling within two months during season. Sellers who overprice are still selling (the community's scarcity ensures demand), but they are giving up DOM and negotiating leverage.
For sellers, the L/S data contains a specific insight. The 2020 ratio of 90.7% (the loosest in the dataset) occurred when $/SF was $395. The 2024 ratio of 97.4% (the tightest) occurred when $/SF was $1,105. Pricing efficiency improved as the market repriced upward, which is the opposite of what most sellers expect. The explanation: as appreciation pushed Old Marsh past $1,000/SF, the buyer pool narrowed to well-capitalized purchasers who move quickly and negotiate less. The market became more efficient, not less, at higher price points.
For buyers, the 95.2% L/S means that aggressive discounting is not the path to acquiring an Old Marsh estate. In 2025, the median buyer paid 94.8% of asking. In 2024, they paid 97.4%. The offer strategy that works here is a clean, well-structured submission at 3% to 6% below ask, with proof of funds or a cash commitment, delivered within the first two weeks of listing. In a 60-home community with 100% cash transactions in 2025, the competitive advantage is speed and certainty, not price negotiation.
Bottom Line
Old Marsh's +163% appreciation and historically fastest DOM in the corridor are confirmed by 56 transactions across six years. The current market is above $1,000/SF, 100% cash in 2025, and operating at one to three months of supply. The scarcity premium relative to Old Palm has not fully materialized in the $/SF (a 6% gap for one-fifth the lot count), which positions Old Marsh as a relative value play within the corridor for buyers who prioritize exclusivity and the Audubon setting over housing stock age and market visibility. For sellers, the data rewards accurate pricing and penalizes overpricing with extended DOM but not with material price concessions: the community's structural scarcity ensures demand.
For sellers pricing a listing: The 2025 L/S of 94.8% and the 2024 figure of 97.4% are your benchmarks. Price within 5% of the most recent comparable sale in your condition class. In a 60-home community, your comp set is three to five transactions, and every buyer's agent has already reviewed them. Aspirational pricing above the comp set will cost DOM without producing a premium.
For buyers positioning an offer: This is a 100% cash market in 2025 with 62-day DOM. Your competitive advantage is speed and certainty: clean cash offer, proof of funds attached, submitted within two weeks of listing. Offers below 94% of ask are inconsistent with the L/S pattern and risk losing the property in a community where the next listing may be months away.
The scarcity thesis: Old Marsh at $1,037/SF versus Old Palm at $1,101/SF for 60 homes versus 300 is a pricing gap the data does not fully explain by product quality alone. Whether the gap closes depends on renovation activity and market visibility, both of which are trending in Old Marsh's favor. The buyer entering today at $1,037/SF in a community with +163% trailing appreciation and one to three months of supply is making a specific bet on scarcity repricing. The data supports that thesis, with the caveat that small-sample volatility is a permanent feature of any 60-home market.
This analysis is based on 56 closed residential transactions in Old Marsh Golf Club from January 2020 through March 2026, sourced from BeachesMLS via Spark API. All 56 transactions are single-family estates. Metrics tracked per transaction include closing price, price per square foot, days on market (from list date to contract date), list-to-sold ratio (closing price divided by final list price), financing method, living area square footage, lot acreage, bedroom count, and year built.
Median values are used throughout. In a community with 4 to 12 sales per year, single outlier transactions can move yearly medians significantly. The 2024 median of $5.01M on 4 sales and the 2026 YTD figure of $6.55M on 1 sale should be interpreted with appropriate caution regarding sample size. Where yearly samples are small, the 2024-25 combined figure (14 sales) provides a more stable benchmark.
Build era cohort $/SF figures are all-time medians across all sale years in the dataset. They quantify the structural premium for newer construction but should not be used as current pricing benchmarks. The pre-1990 cohort $/SF ($827) is inflated by two small-footprint homes (approximately 2,400 SF) where the smaller living area produces a higher per-square-foot figure despite lower absolute prices.
Corridor comparisons (Old Palm, Bears Club, Loxahatchee, Admirals Cove, Frenchman's Creek, Lost Tree, Mirasol) use the same BeachesMLS dataset and methodology applied to each community's sales data over the same 2020 to 2026 period.
Transaction Data: BeachesMLS via Spark API. 56 closed residential sales in Old Marsh Golf Club, January 2020 through March 2026. Accessed March 2026.
Comparative Market Data: BeachesMLS via Spark API. Closed sales data for Old Palm, Bears Club, Loxahatchee Club, Admirals Cove, Lost Tree Village, Frenchman's Creek, and Mirasol over the same period.
Property Tax Data: Palm Beach County Property Appraiser records.