The Two Markets
The side-by-side table separates the two markets cleanly. Fort Lauderdale's market is broad and liquid: nearly twice the closings, three-quarters of them on water, at a lower $1,124 per foot. The median of 104 days to contract is slower, which reflects the depth of inventory available there. West Palm Beach's market is narrow and premium: half the sales at $1,310 per foot with faster time to contract. A higher share of the dollars concentrates in the Flagler corridor's towers and the older estate pockets behind it. Neither market is better in the abstract. The two cities sell different assets at the same price level.
Source: BeachesMLS regional feed, closed residential sales at $3M+, both markets
Source: BeachesMLS regional feed, trailing twelve months
Canals Against a Corridor
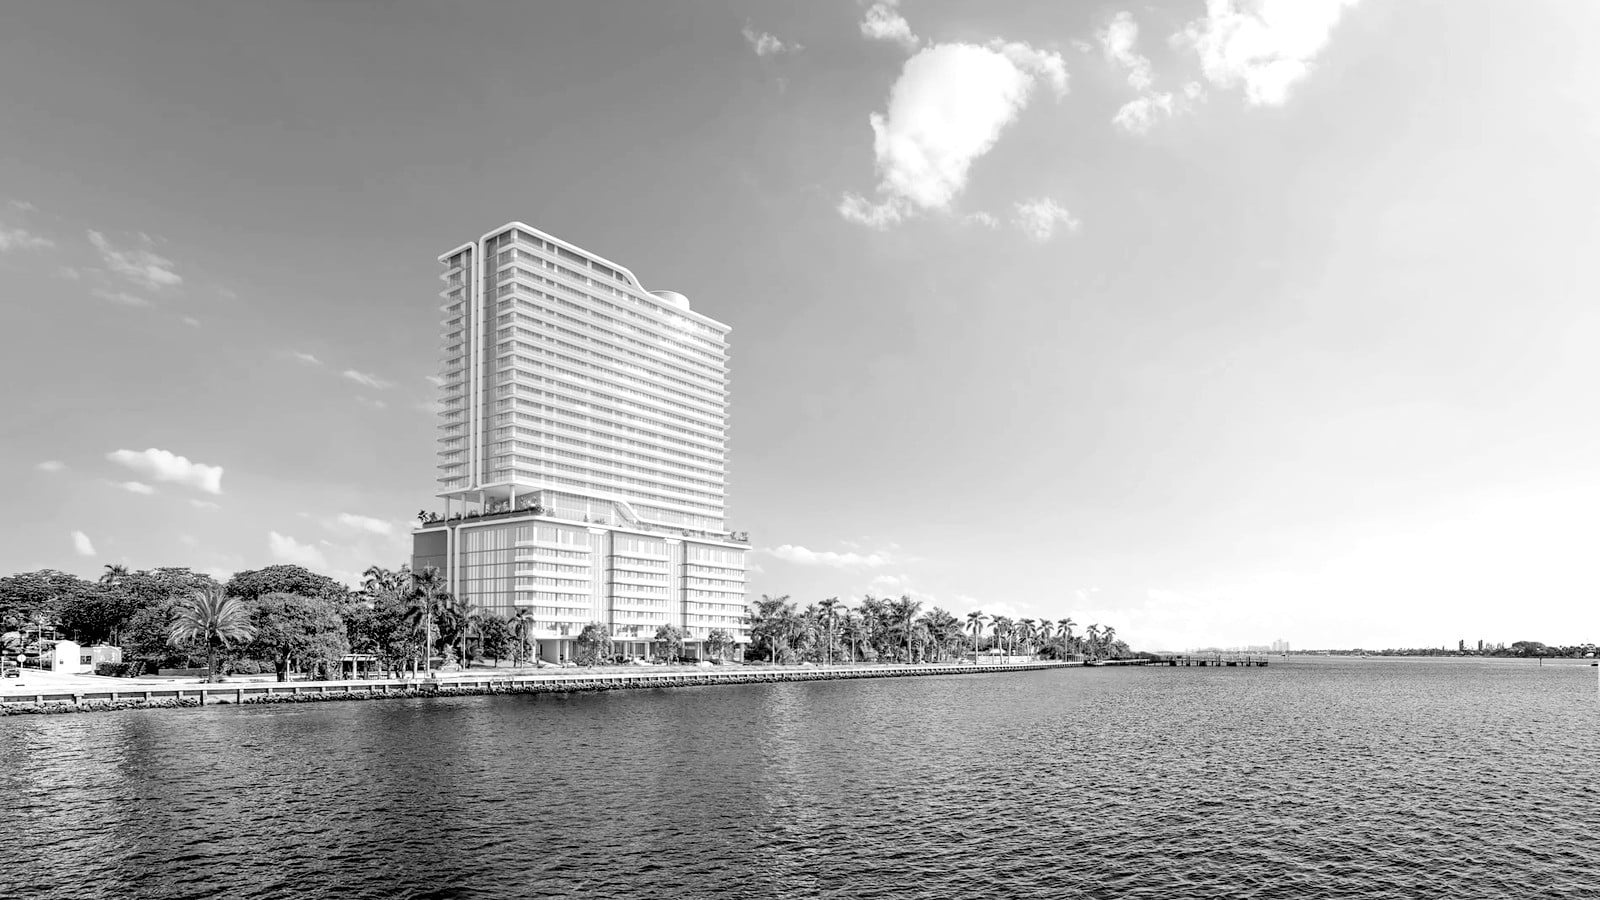
The waterfront numbers explain most of the comparison. Fort Lauderdale's grid of navigable canals makes waterfront a neighborhood feature, 157 closings in a single year. Dockage is priced into ordinary streets, and a yachting culture is built on that abundance. West Palm Beach's water is one corridor, a single line of Intracoastal frontage shared between towers and a short run of estates. Its 35 waterfront closings came at a premium for exactly that reason. A boater comparing dockage per dollar should look south, and a buyer paying for the rarity of a Flagler address should look north.
The Tower Premium
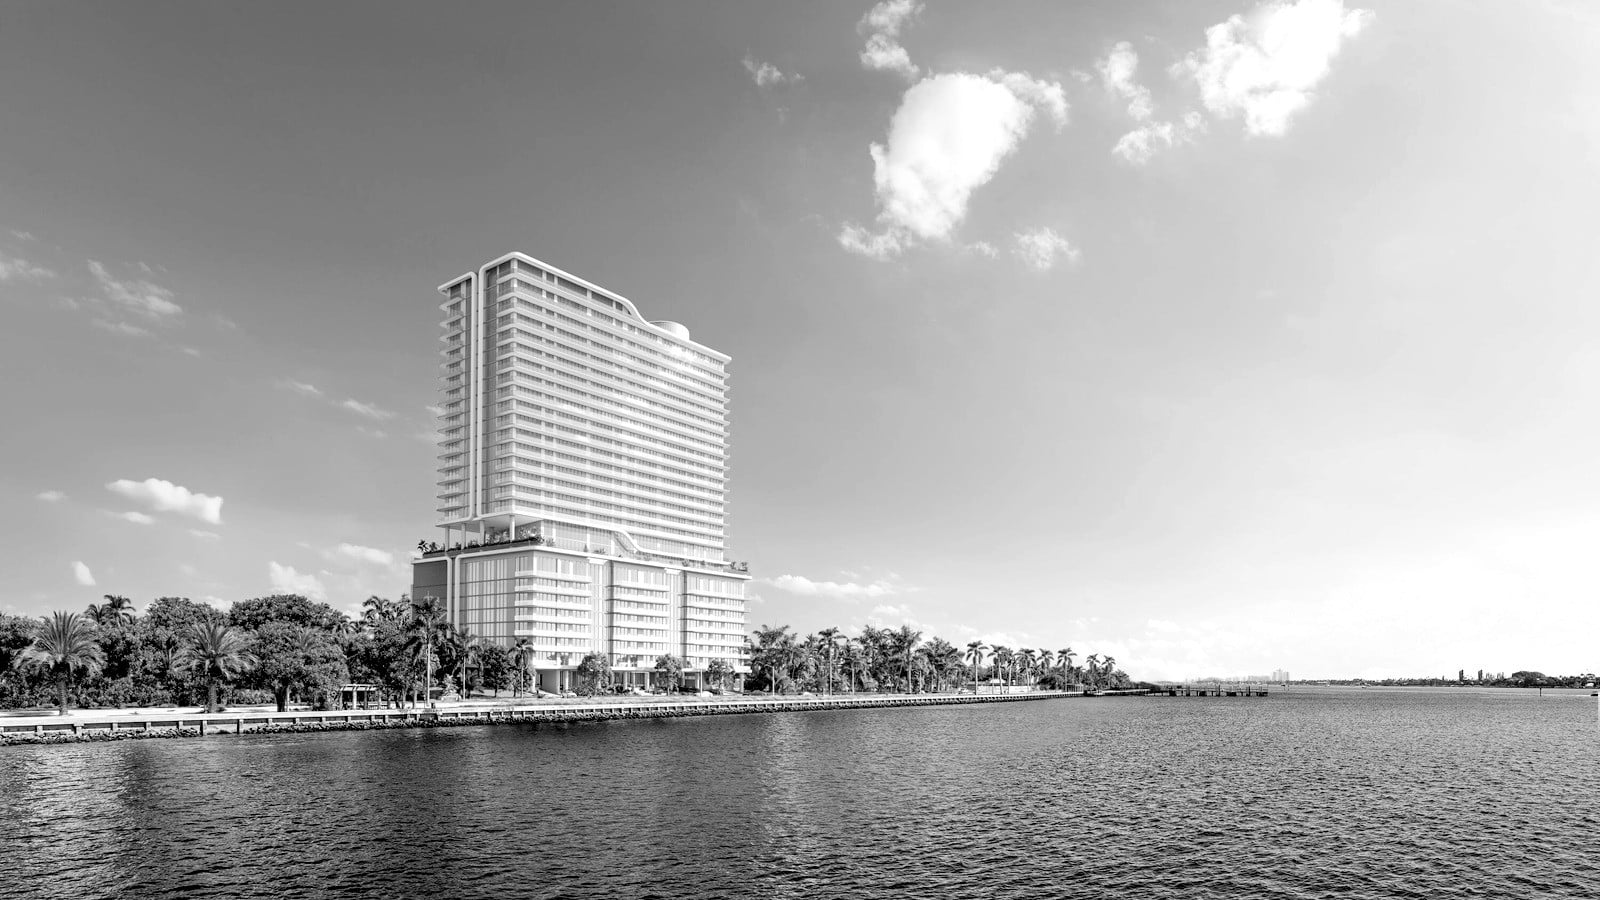
The widest gap in the table sits in the condominium line: $1,846 per foot for West Palm Beach's towers against $1,301 for Fort Lauderdale's. The premium comes from a short supply of corridor buildings next to a financial district that keeps bringing new buyers to the city. Our Flagler corridor study documents the pattern building by building. Fort Lauderdale's tower stock is larger, more varied, and priced closer to its houses. West Palm Beach's is scarce enough that a handful of buildings set the whole tier, and the premium reflects that scarcity.
Choosing Between Them
The choice usually comes down to three questions. The first is product: a canal house with private dockage argues for Fort Lauderdale, where the selection is real, while corridor towers and estate-section scarcity argue for West Palm Beach. The second is liquidity: Fort Lauderdale's depth, 204 sales and 22 above ten million dollars, offers the easier eventual exit. Our comparison of Jupiter and Miami measured the same trade-off along the coast's other axis. The third is trajectory. West Palm Beach's premium is a bet that the corridor keeps maturing into an institutional market, a bet the last five years have rewarded. Fort Lauderdale's value case rests on the broad waterfront market it already leads. Both have worked in recent years, and they are different bets.
One caveat sits outside the sales data. The two cities are in different counties, with different property taxes, insurance markets, and airports. Those ownership costs shift a full comparison in ways no multiple listing service (MLS) field captures. The MLS measures the purchase, the counties shape the annual cost of owning the home, and a serious shortlist weighs both.
Bottom Line
Fort Lauderdale offers depth: twice the sales, three-quarters of them on water, at $1,124 per foot. West Palm Beach offers scarcity: one corridor, half the sales, at $1,310. One market suits buyers who want selection and an easy resale, and the other suits buyers who value scarcity. The decision becomes clear once the buyer knows which of the two assets they want.
For buyers holding both cities on a shortlist: Decide the asset before the city. Dockage per dollar and the easier exit point to Fort Lauderdale, while corridor scarcity and the stronger price trend point to West Palm Beach. A buyer who decides the asset first will usually find that only one of the two cities offers it.
This comparison covers residential closings at $3,000,000 or above from July 1, 2025 through June 30, 2026 in West Palm Beach (110 sales) and Fort Lauderdale (204 sales). Both are drawn from the same regional MLS feed and deduplicated identically, including cross-listed records. Medians are used throughout and are reported per product where the products diverge. Days on market measure list date to contract date. The share of asking price kept divides close price by original list price. Tax, insurance, and ownership-cost differences between the two counties are material to a full ownership comparison and are outside this study's MLS scope.
All data sourced from BeachesMLS via the Spark API.